Term Structure of Interest Rates - Spot, Par, and Forward Curves
Go to Fixed Income
Topics
Table of Contents
Introduction
In the previous learning modules, we priced fixed income securities by discounting future cash flows using a single interest rate (such as the yield-to-maturity or MRR plus a discount margin).
In this learning module, we will cover how to price fixed income securities using a sequence of interest rates. We will introduce the concept of term structure of interest rates, and the three common ways of representing the term structure – spot rate curve, par curve, and forward curve.
Maturity Structure of Interest Rates and Spot Rates
Maturity Structure of Interest Rates
The term structure of interest rates is the relationship between interest rates and bonds with different times to maturity. The basic premise is that interest rates change when inflation rates are expected to change over a period of time.
A one-year zero-coupon bond may have an interest rate of 7.50%, while a two-year zero-coupon bond may have an interest rate of 9.75%, assuming all the other factors are the same (currency, credit rating, periodicity, etc.).
The three common ways of representing the term structure – spot rate curve, par curve, and forward curve.
Spot rate curve: In our example above, the interest rates of zero-coupon bonds, 7.50% and 9.75% are called spot rates. Spot rates are yields to maturity (or return earned) on zero-coupon bonds maturing at the date of each cash flow, if the bond is held to maturity. So, the spot rate curve is also called the zero or strip curve. The spot rate curve plots different maturities on the x-axis and corresponding spot rates on the y-axis.
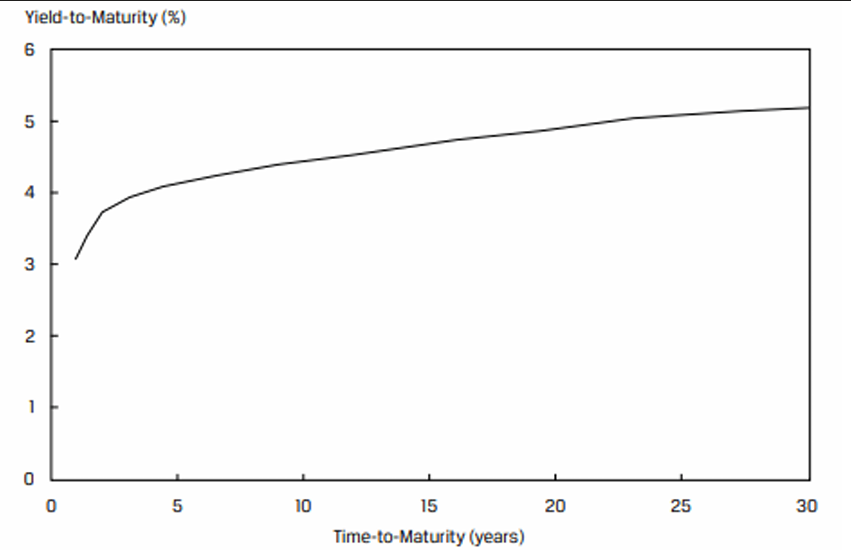
This spot curve is upward sloping, which means that longer-term government bonds have higher yields than the shorter-term bonds. This is the pattern typically observed under normal market conditions. However, unique circumstances can also result in a spot curve that is flat or downward sloping.
While a zero-coupon government bond spot curve is ideal for analysis, there are several practical issues to consider.
- Most actively traded government bonds make coupon payments (i.e. they are not zero-coupon).
- Older bonds tend to be less liquid than newly issued debt.
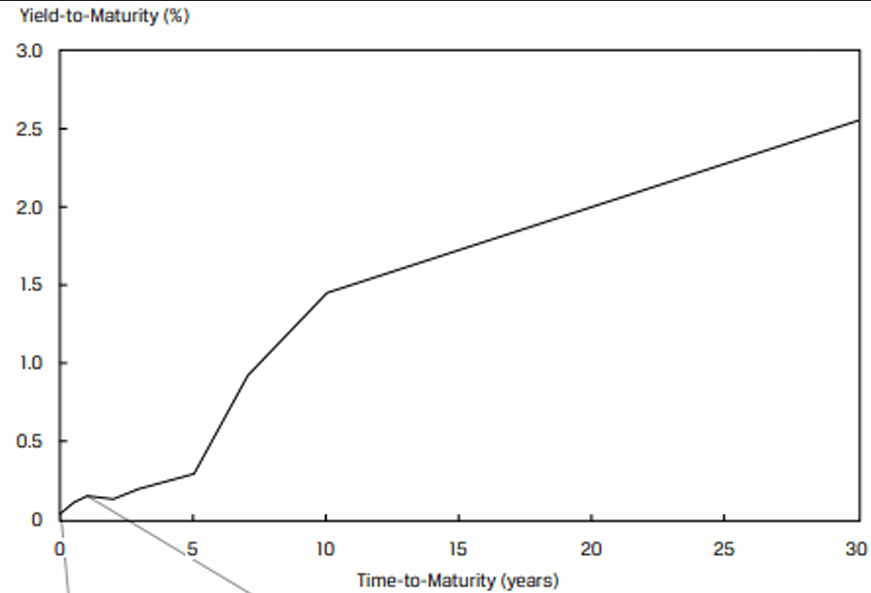
In practice, only the most recently issued actively traded government bonds are used to build a yield curve. Exhibit 2 illustrates a yield curve for a government that issues 2, 3, 5, 7, 10, and 30 year bonds. Straight line interpolation is used to complete the curve.
Bond Pricing Using Spot Rates
Spot rates are yields to maturity on zero-coupon bonds maturing at the date of each cash flow. Since zero-coupon bonds have no intermediate cash flows, the actual yield on a zero-coupon bond is used as the discount rate for a cash flow occurring at the same maturity date.
Bond price (or value) determined using spot rates is sometimes referred to as the bond’s no-arbitrage value. If a bond’s price differs from its no-arbitrage value, an arbitrage opportunity exists in the absence of transaction costs.$$PV=\sum_{i=1}^{N} \frac{PMT}{(1+Z_i)^i} + \frac{FV}{(1+Z_N)^N} $$where:
- PMT = Coupon payment
- FV = Par value of the bond
= Spot rate or yield of zero-coupon bond for period N
The one-year spot rate is 2%, the two-year spot rate is 3%, and the three-year spot rate is 4%. What is the price of a three-year bond that makes a 5% annual coupon payment?
Solution: Think of the bond as a portfolio of three zero-coupon bonds with one, two and three-year maturities with yields of 2%, 3%, and 4% respectively.
Bond’s no-arbitrage value = 102.96
Is there a single rate (yield) for the bond that equals the present value of cash flows to its purchase price?
Computing for r, we get 3.93%, which is the bond’s yield to maturity.
Par and Forward Rates
Par Rates from Spot Rates
Spot rates are often used to determine par rates. A par rate is a yield-to-maturity that makes the present value of a bond’s cash flows equal to par (100% of face value). Par rates derived for hypothetical government bonds with different maturity dates are commonly used for term structure analysis because they incorporate tax, trading, and other potential distortions associated with actual bonds priced at a discount or premium.
Given a sequence of spot rates (
Notice that this equation is similar to the bond pricing using spot rates equation, expect PV = FV = 100. Also, for a bond to trade at par, its coupon rate and yield-to-maturity must be equal. So by solving for PMT, we also solve for the YTM for the bond to trade at par. This single rate is divided by 100, to obtain the par rate per period.
Suppose the current one-, two-, three-, and four- year spot rates on government bonds are 5.263%, 5.616%, 6.359%, and 7.008%, respectively. These are effective annual rates. Calculate the par rates.
Solution
The one-year par rate is → PMT = 5.263
The two-year par rate is → PMT = 5.606
The three-year par rate is → PMT = 6.306
The four-year par rate is → PMT = 6.899
Forward Rates from Spot Rates
A forward rate is an interest rate in the future. The one-year interest rate after one year is an example of a forward rate. The implied forward rate can be calculated using spot rates.
Consider a scenario where the one-year spot rate is 2%, and the two-year spot rate is 3%.
The forward rate
Mathematically, this can be expressed as:
Solving for
The notation for a forward rate is expressed like this: 1y1y, 2y5y. The first number refers to the length of the forward period in years from today and the second number refers to the tenor of the underlying bond. Thus, 1y1y is the rate for a 1-year loan one year from now and 2y5y is the rate for a 5-year loan, two years from now.
Spot Rates from Forward Rates and Bond Pricing with Forward Rates
Just like forward rates can be calculated from spot rates, spot rates can also be calculated from forward rates because they are interconnected.
0y1y → (1.88%), 1y1y → (2.77%), 2y1y → (3.54%), 3y1y → (4.12%)
The four-year spot rate can be calculated as: $$(1.0188 \times 1.0277 \times 1.0354 \times 1.0412) = (1 + Z_4 )^4 → Z_4 = 0.030741$$
Bond Pricing with Forward Rates
Suppose that an analyst needs to value a four-year 3.75% annual coupon payment bond that has the same risks as the bonds used to obtain the forward curve. Using the implied spot rates, the value of the bond is 102.637 per 100 of par value.
The bond also can be valued using the forward rates as follows:
The bond also can be valued using the forward rates as follows: $$\sum_{i=1}^4 \frac{3.75}{\prod_{j=1}^{i}(1+Z_j)} +\frac{100}{1.0188 \times 1.0277\times 1.0354\times 1.0412} = 102.637$$
Spot, Par, And Forward Yield Curves and Interpreting Their Relationship
Since par and forward rates can be derived from spot rates, the shape of the spot curve is closely related to the shape of the par and forward curves.
| Spot curve is upward sloping | Spot curve is flat | Spot curve is downward sloping |
|---|---|---|
 |
 |
 |
| Par is below spot curve | Par = spot curve | Par is above spot curve |
| Forward is above spot curve | Forward = spot curve | Forward is below spot curve |
- When the spot curve is upward sloping, the par rates will be near, but below the spot rates and the forward rates will be greater than the spot rates.
- When the spot curve is flat, the par rates and forward rates will be equal to the spot rates.
- When the spot curve is downward sloping, the par rates will be close to but greater than the spot rates and the forward rates will be lower than the spot rates.