Credit Risk
Go to Fixed Income
Topics
Table of Contents
Introduction
This learning module covers:
- Credit risk and its components – probability of default and loss given default
- Role of credit ratings in debt markets
- Factors that influence the level and volatility of yield spreads
Sources of Credit Risk
Credit risk is the risk that the borrower will fail to make principal and/or interest payments on time.
Traditionally, many analysts assessed creditworthiness using what are known as the Cs of credit analysis.
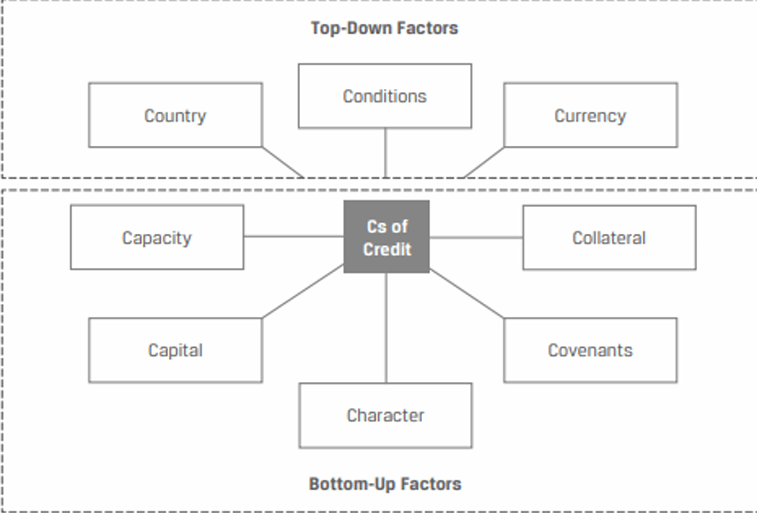
The five bottom-up factors that are applicable to an individual borrower are:
Capacityrefers to the ability of the borrower to make its debt payments on time.Capitalrefers to other company resources available that reduce reliance on debt.Characterrefers to the quality of the management and the willingness to pay debt.Covenantsrefers to the terms and conditions of the debt agreement that the issuer must comply with.Collateralrefers to the quality and value of the assets pledged against the debt.
The remaining three factors are general top-down factors that apply to all borrowers:
Conditionsrefers to general economic, competitive, and business environment faced by all borrowers that may impact their ability to service or refinance debt.Countryrefers to the geopolitical environment as well as the legal and political system faced by all issuers in a jurisdiction.Currencyrefers to cash flows affected by exchange rate changes, such as import/export or borrowings in foreign currency.
Sources of Credit Risk
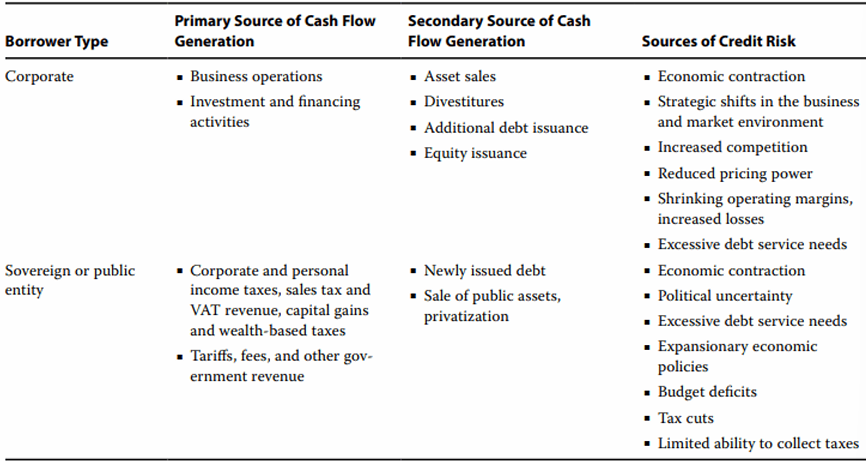
As shown in the exhibit, many factors can affect the primary and secondary sources of repayment for different fixed-income issuers.
Measuring Credit Risk
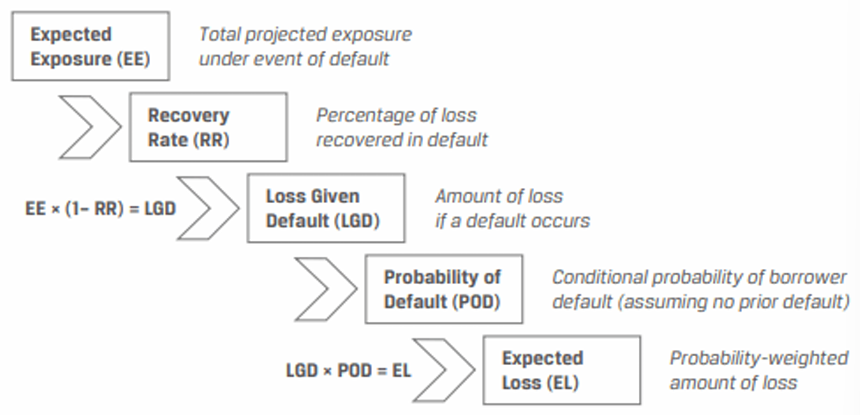
Credit risk has two components:
- Probability of default (POD): The likelihood that an issuer fails to make full and timely payments of principal and interest.
- Loss given default (LGD): How severe is the loss incurred by the investor? What portion of the bond’s value (including interest) is not paid by the issuer? A default leads to various severity of losses; for instance, the loss may be total, or the bondholders may recover some value.
We combine both the components into a single term called the expected loss.
Expected Loss = POD x LGD
The loss given default depends on:
- Exposure at default (EAD): The size of the investor’s claim at the time of default.
- Recovery rate (RR): Represents the percentage of an outstanding debt claim recovered when an issuer defaults. A related term is loss severity (1-RR) which represents the unrecovered portion of the claim.
LGD = EE x (1 – RR)
One way to interpret a fixed-income security’s expected loss for a given period is to compare it to the compensation an investor expects for taking on a borrower’s credit risk over that period, which is the credit spread. We can say that an investor is fairly compensated if the expected loss is equal to the credit spread for a given period.
Credit Spread ≈ POD × LGD
A bond investor analyzing a company’s unsecured debt estimates a POD of 2% and an LGD of 80%. The observed actual credit spread for this bond is 200 bps per year. Is the investor fairly compensated/ less than fairly compensated/more than fairly compensated for assuming the company’s credit risk?
Solution: Since POD × LGD = 1.60% and the credit spread is 2.00%, Credit Spread > POD × LGD and the investor would expect to be more than fairly compensated for assuming the company’s credit risk.
Credit Rating Agencies and Credit Ratings
Moody’s, S&P, and Fitch are the three main rating agencies. At least two of these agencies assign a rating to the majority of the bonds.
Credit Ratings
Be familiar with what the ratings are (Aaa represents the highest quality among investment grade securities, etc.). The rating system is almost similar across agencies starting from A for investment grade to C/D for junk.
Long-Term Ratings Matrix: Investment Grade vs. Non-Investment Grade
| Moody's | S&P or Fitch | |
|---|---|---|
| High Quality | Aaa, Aa1, Aa2, Aa3 | AAA, AA+, AA, AA- |
| Upper Medium | A1, A2, A3 | A+, A, A- |
| Low Medium | Baa1, Baa2, Baa3 | BBB+, BBB, BBB- |
| Speculative Grade | Ba1, Ba2, Ba2, B1, B2, B3, Caa1, Caa2, Caa3, Ca, C | BB+, BB, BB-, B+, B, B-, CCC+, CCC, CCC-, CC, C |
| Default | D | D |
- Bonds rated AAA/Aaa have the highest quality, lowest credit risk, and lowest probability of default. They have extremely low default rates.
- Bonds rated Baa3/BBB- or higher are investment grade bonds. Investment grade is further divided into high-quality, upper-medium and low-medium.
- Bonds rated lower than Baa3/BBB- are non-investment grade bonds. Non-investment grade includes speculative and default bonds. These have higher default risk.
- Outlook: This is an additional indicator on a rating. The outlook can be positive, stable, or negative.
- The rating agencies may also indicate the potential direction of the ratings by including comments like
on review for a downgradeoron credit watch for an upgrade. Credit migration riskis the risk that a bond issuer’s creditworthiness deteriorates, or migrates to a lower rating, leading investors to believe that the risk of default is higher.
Note: Investment-grade ratings focus more on timeliness, while non-investment grade ratings give more weight to recovery.
Credit Rating Considerations
There is sufficient evidence that rating agencies, in general, have done a good job of assigning ratings that reflect the risks involved. However, these ratings are not foolproof and have their own limitations.
Analysts should conduct their own credit analysis, as sole reliance on credit rating to make investment decisions has several pitfalls:
- Credit ratings can be very dynamic: Credit rating of a bond issue may change over time. There have been instances where an “AAA” rated bond at issuance has turned into non-investment grade or junk within three years.
- Rating agencies are not infallible: The high ratings on subprime-backed mortgage securities are the best example of this. If the rating agencies had rated the issue appropriate to their risk level, it would have made investors cautious.
- Idiosyncratic or event risks are difficult to capture in ratings: Rating agencies do a poor job of foreseeing event risks because it is not possible and these cannot be reflected in a credit rating.
- A recent example is of the March 2011 tsunami that hit Japan, which in turn affected the credit risk of Tokyo Electric Power Company.
- Ratings tend to lag market pricing of credit: Bond prices move on a daily basis based on the perceived credit risk in them, as the market sees it. But rating agencies do not revise their ratings that often. Investors who time their buy/sell decisions solely on the ratings issued by agencies are at the risk of underperforming the market. But a sudden downgrade has a disastrous effect on bond prices.
Factors Impacting Yield Spreads
The yields on extremely liquid bonds with virtually no default risk (e.g., government bonds) will be equal to real interest rate plus a premium for expected inflation.
The yields on corporate bonds will include an additional risk premium that compensates investors for credit and liquidity risk and possibly the tax impact of holding a specific bond. This additional risk premium is called a spread.
Factors that affect the spread on corporate bonds
- Credit cycle: Credit spreads narrow when the credit cycle improves; a spread is narrower at the top of a credit cycle. Credit spreads widen when the credit cycle deteriorates as seen during the recent credit crisis after 2008.
- Broader economic conditions: Credit spreads widen in a weak economy and narrow in a strong economy.
- Funding availability in the financial sector: Unlike stocks that primarily trade on exchanges, bonds usually trade over the counter. Brokers and dealers are market makers in the debt market. Yield spreads are narrow when brokers-dealers provide sufficient capital.
- However, at times of crisis as seen during the post-2008 period, many broker dealer firms either closed down or were acquired. The capital available for making markets reduced substantially leading to wider spreads.
- General market supply and demand: If the supply is more and demand is less, credit spreads will widen.
- Financial performance of the issuer: Earnings releases, news, and other developments associated with the issuer affect credit spreads. Good news will narrow spreads while bad news will widen spreads.
A number of these factors caused spreads to widen dramatically during the 2008-2009 global financial crisis.
Reasons for investing in HY bonds
Aside from the higher coupons typically offered by high-yield bonds to compensate for their higher risk, there are several reasons to invest in HY bonds:
- Portfolio diversification: HY bonds typically have a low correlation with IG bonds and default risk-free interest rates.
- Their inclusion in a fixed-income portfolio may therefore provide diversification benefits.
- Capital appreciation: Economic recovery or improved issuer-specific performance has a more sizeable positive impact on HY than IG bond prices.
- Equity-like return with lower volatility: While HY bond and equity prices tend to fluctuate similarly over the economic cycle, HY bond returns tend to be more stable due to their higher income component versus stocks.
The Price Impact of Spread Changes
How changes in spread affect the price and return of a bond:
Two factors that affect the return on a bond are:
- Modified duration: Price sensitivity to interest rate changes.
- Magnitude of the spread change.
Return impact with and without convexity adjustment