Industry and Competitive Analysis
Go to Equity Investments
Topics
Table of Contents
Introduction
This learning module covers:
- How an industry is defined and the challenges associated with grouping companies that operate in multiple industries.
- How to determine an industry’s size, growth characteristics, profitability, and market share trends.
- How to analyze the competitiveness of an industry using Porter’s Five Forces and PESTLE frameworks.
- Evaluating the competitive strategy and position of a company.
Uses of Industry Analysis
As seen in a prior exhibit, the next step in the company and industry analysis framework is industry and competitive analysis. This involves the study of the drivers of an industry’s size, profitability, and market share trends. We also evaluate a company’s competitive positioning in its industry.
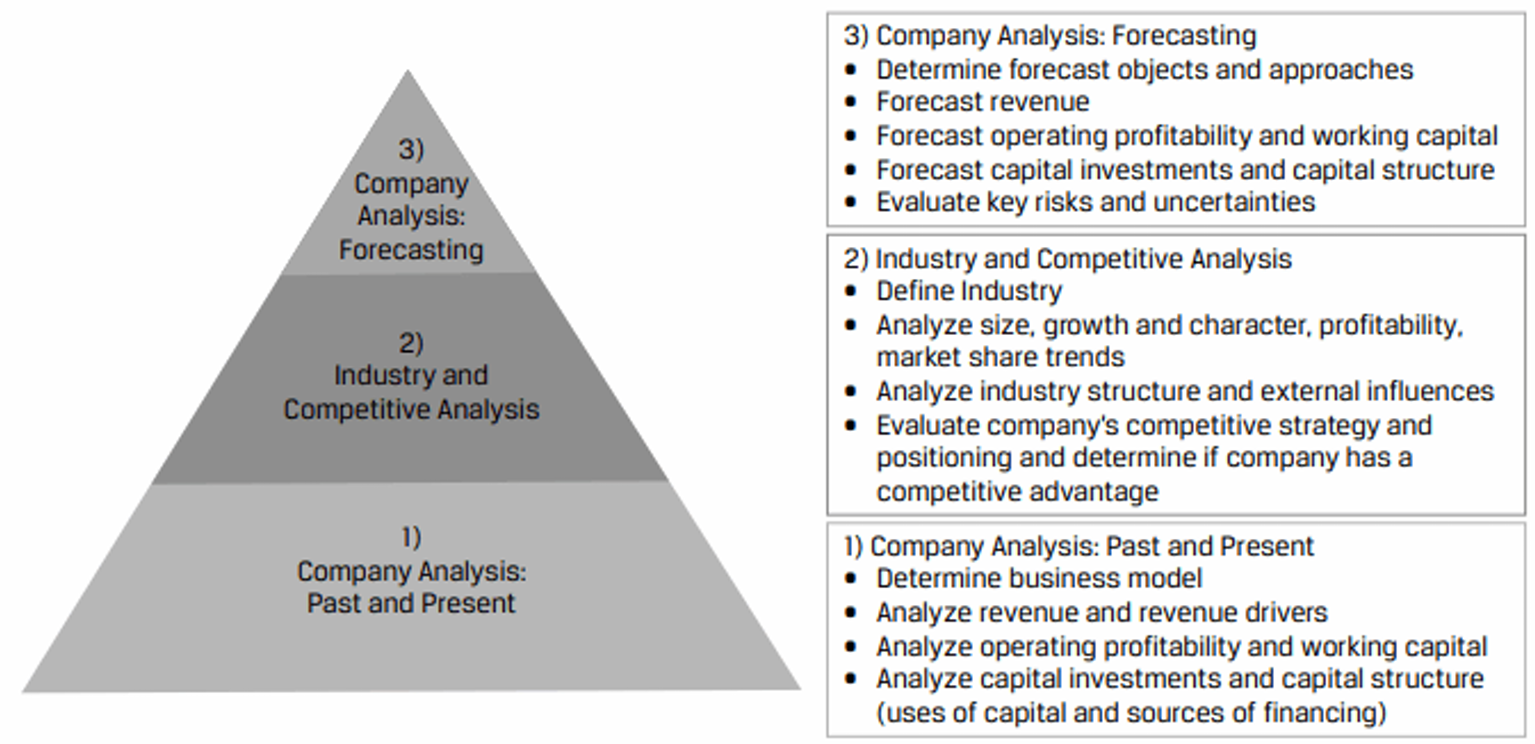
Why Analyze an Industry?
- Companies in the same industry have similar business models. They tend to be exposed to the same demand and supply opportunities and risk factors.
- In a study conducted on the relative importance of industry versus company-specific effects on profitability, it was found that industry was the most important factor in the sustainability of economic profit.
An average company in a growing industry may perform well than a good company in a dying industry.
Improve Forecasts
By taking a broader industry perspective, analysts can better understand the dynamics in which a company operates and make better earnings forecasts. Without this broader perspective, analysts may underestimate competitive forces and overestimate the degree to which a company controls its destiny.
Identify Investment Opportunities
Assessing a company’s strength and weaknesses relative to industry peers can help uncover attractive investment opportunities. Some investors may want to gain exposure to a specific industry while diversifying away the company-specific risks. These investors may take a basket approach, investing in a number of companies from that industry with position sizes scaled according to size, liquidity, or relative attractiveness.
Industry and Competitive Analysis Steps
Industry Classification
An industry is commonly defined as companies that sell similar products or services, from the perspective of a customer.
Defining industries and classifying companies can be challenging. To assist analysts, third party organizations maintain industry classification schemes that are widely used in investment management.
Third-Party Industry Classification Schemes
Classification systems are provided by both commercial entities and government agencies. However, commercial classification systems are commonly used in the investment industry because they are more frequently updated as compared to government classification systems.
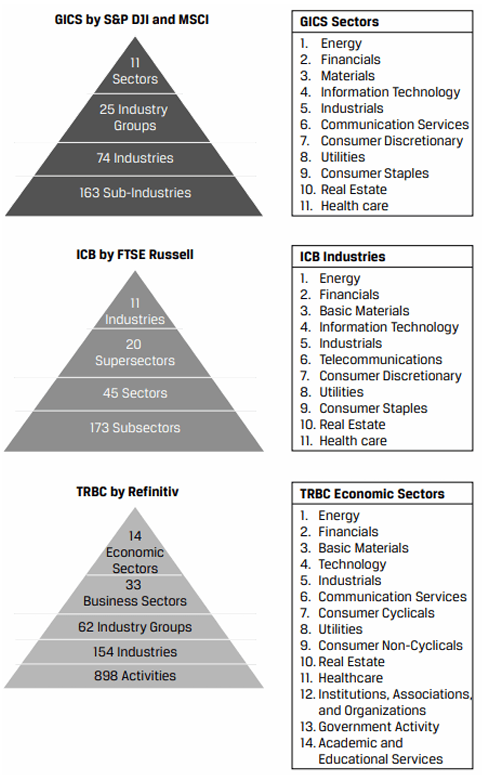
3 widely used commercial industry classification schemes are:
- Global Industry Classification Standard (GICS) by MSCI and S&P Dow Jones Indices
- Industry Classification Benchmark (ICB) by FTSE Russell
- The Refinitiv Business Classification (TRBC) by Refinitiv
These classification systems contain multiple levels: starting at the broadest level – a general sector grouping, that is then subdivided into more narrowly defined sub-industry groups. Exhibit 3 from the curriculum shows the names and hierarchy of each scheme, the number of groups in each tier, and the composition of the highest tier.
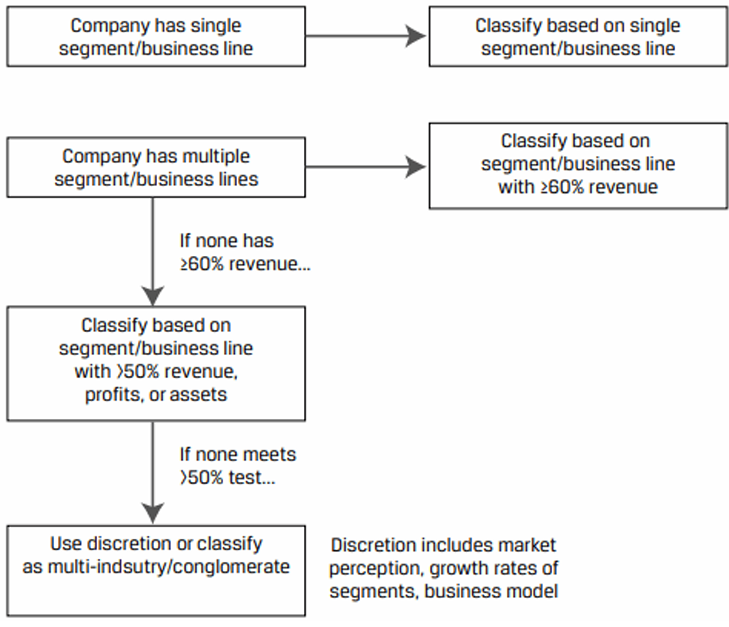
The general process of classifying companies is illustrated in Exhibit 4.
Limitations of Third-Party Industry Classification Schemes
Third party classification systems are a useful starting point; however, analysts need to be aware of the methodologies and the limitations of these systems.
4 important limitations are:
- Groupings of companies with business model variations or that sell substitute products
- The classification of multi-product companies
- Geographical considerations
- Changes in groupings over time that affect prior-period comparability of industry statistics
Defining Industry
Warehouse Club Inc. has a single line of business and would be assigned to the “Consumer Staples Merchandise Retail” sub-industry in GICS.
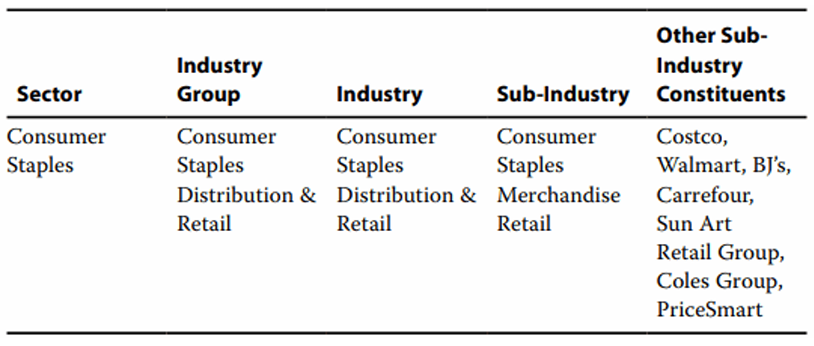
While this classification is logical, the sub-industry includes companies outside Warehouse’s domestic geography that are less relevant to its customers and does not include many companies in its domestic geography that sell similar products to the same types of customers. For example, grocers and drugstores are included in a different sub-industry (Food Retail and Drug Retail, respectively), and e-commerce retailers that it competes with are in a different sector entirely (Consumer Discretionary).
The challenge in placing Warehouse in an industry is that it sells several categories of consumer goods, both staples and discretionary goods like apparel, as do many other companies. Retailers also have varying business models—including membership-based warehouses, e-commerce, and co-locations with other services like pharmacies—and have varying location, assortment, and pricing strategies.
Elaine Nguyen chooses to define Warehouse’s industry more broadly than its GICS sub-industry by taking a customer perspective: retailers of all kinds operating in Warehouse’s domestic geography, except for automobile and auto parts retailers as Warehouse does not sell those products or even substitutes for them (and it is a large category of domestic retail sales). Nguyen also does not include restaurants and food services, instead considering them substitutes.
Alternative Methods of Grouping Companies
Apart from the similarity of product/service approach, alternative approaches to grouping companies are:
- Geography: Companies can be classified by country and then countries can be aggregated into categories such as developed, emerging, and frontier markets.
- Sensitivity to the business cycle: Depending on their sensitivity to the business cycle, companies can be classified into:
- Defensive: Earnings are relatively stable over the business cycle. They produce goods or services for which is not affected much by the business cycle. Examples of non-cyclical industries are food and beverage, household and personal care products, health care, and utilities.
- Cyclical: Earnings are highly dependent on the stage of the business cycle. They produce goods or services that are often expensive and/or represent purchases that can be delayed. Examples of cyclical industries are autos, housing, basic materials, industrials, and technology.
- Statistical similarities: Companies that historically have had highly correlated returns are grouped together.
- ESG characteristics: Companies are grouped together on some metrics such as the ratio of carbon emissions to revenues, board and executive personnel diversity, and exposure to certain business such as tobacco and gambling.
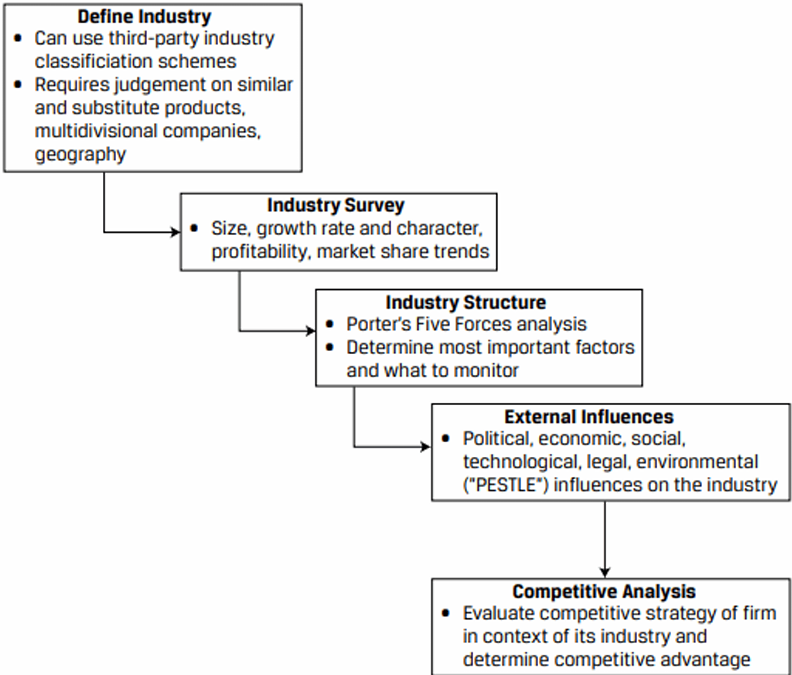
Industry Survey
After defining an industry, the next step is to survey the industry by estimating its size, calculating its historical growth rate, evaluating the nature of that growth rate, measuring profitability, and identifying major industry players and market share trends over time.
Industry Size and Historical Growth Rate
The size of an industry is typically measured by total annual sales from a product or customer perspective, which does not necessarily include all sales of each industry constituent. For example, Amazon’s retail segment sales would be included in sizing the retail industry, but Amazon Web Services segment sales would not be.
Characterizing Industry Growth
An industry’s growth rate can be characterized in a style box as shown in Exhibit 5.
| Mature | Growth | ||
|---|---|---|---|
| Defensive | - Utilities - Beverages - Pharmaceuticals |
- Biotech - Software - Gaming |
|
| Cyclical | - Crude Oil - Natural Gas - Freight Transportation |
- Semiconductors - Fintech - Digital Ad |
Industry Profitability Measures
The best measure of industry profitability is return on invested capital (ROIC) which measures after-tax operating profits for each dollar of invested capital and is agnostic to capital structure.
A profitable industry (high ROIC) is preferable to an unprofitable one. Rather than a point estimate of ROIC, a time series of ROIC gives a more meaningful picture. It helps answer the question – Is the industry profitability rising or falling?
Market Share Trends and Major Players
Market shares are measured by expressing industry participant’s annual revenues as percentages of industry size each year.
The Herfindahl–Hirschman Index (HHI) is frequently used to measure industry concentration. It is calculated by squaring the market share of each firm competing in a market and then summing the resulting numbers. High numbers indicate high concentration and vice-versa.
The HHI of a market composed of four firms with shares of 30, 30, 20, and 20 is
Example
Industry Size and Growth Rate
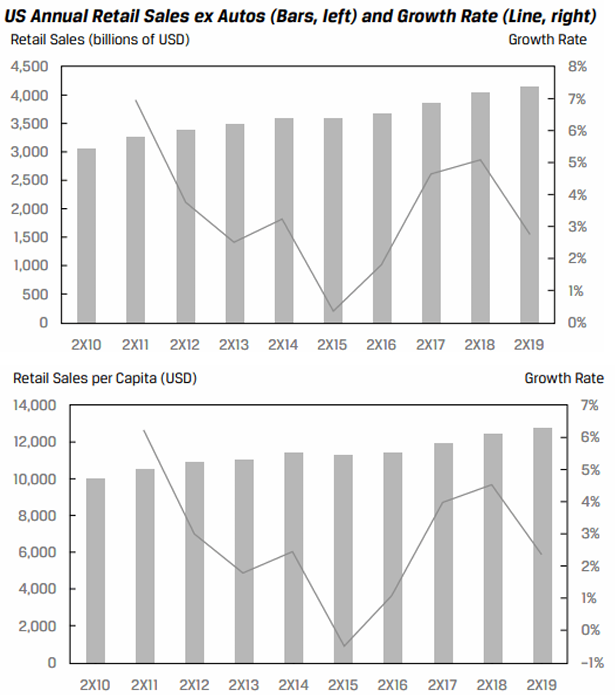
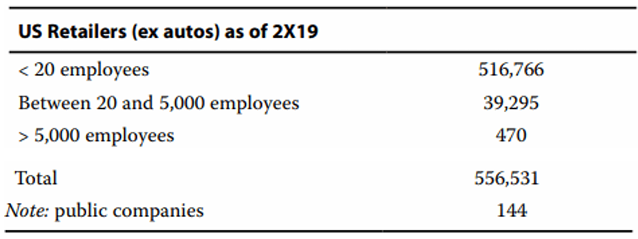
Elaine Nguyen sizes the US retail (excluding autos) industry using three measures: total annual revenues, annual revenues on a per capita basis, and the number of retailers. For all these measures, Nguyen uses data from the US Census Bureau, since the industry consists mostly of small businesses with no public filings and the data are high quality; the Bureau has been collecting such data since 1952.
At the end of 2X19, there were 556,531 firms in the industry, but over 92% of them employed fewer than 20 people. Just 470 large firms with over 5,000 employees accounted for 62% of total industry employment. Of these large firms, 144 were publicly traded.
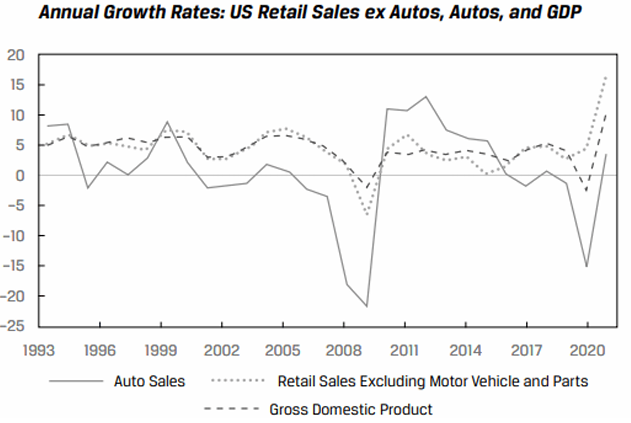
 ##### Character of Industry Growth ---The retail industry has existed for hundreds of years in the USA, though there have been many changes in both form (e.g., department stores, discounters, e-commerce) and the products sold. Comparing industry sales growth with GDP growth since the early 1990s shows that the two are tightly related. However, the industry does not show extreme cyclicality, unlike the auto industry. Elaine Nguyen classifies the industry as mature and moderately cyclical.
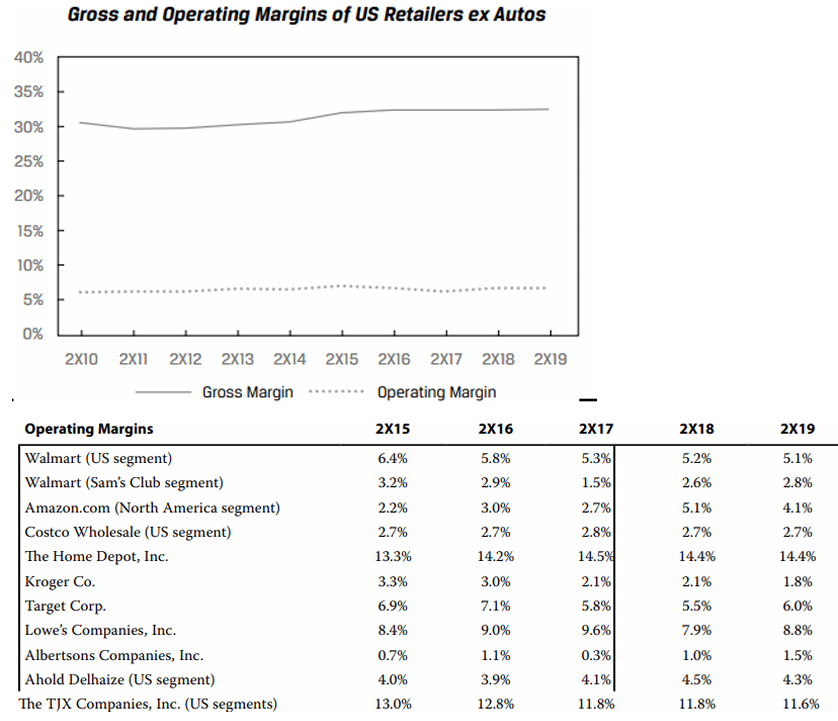
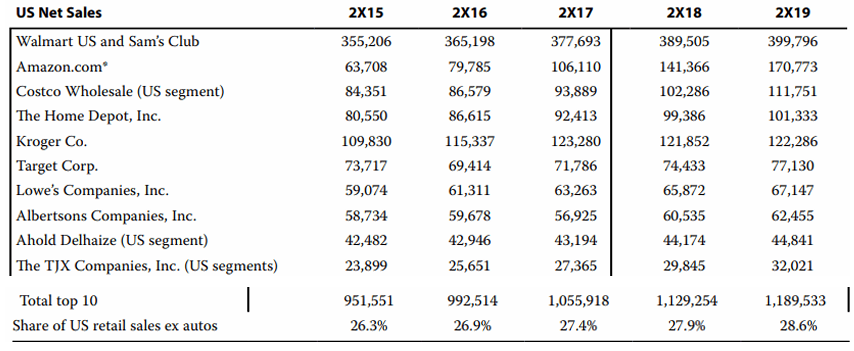
 ##### Industry Profitability ---Nguyen analyzes industry profitability in two ways: (1) the gross and operating margins of all retailers (except autos) in the USA using Census Bureau data and (2) the profitability of the 10 largest publicly traded retailers in the USA by 2X19 sales. Because of segment disclosure changes, M&A, and other corporate transactions, Nguyen examines the last 5 rather than 10 years of data.
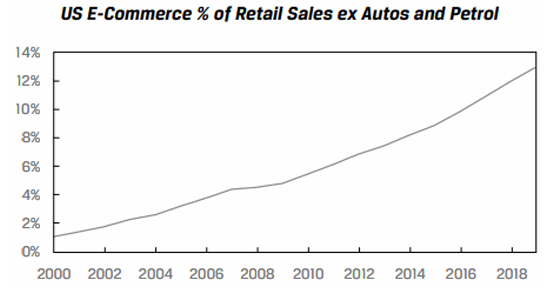
 ##### Market Share Trends ---The most significant market share trend in US retail is the shift toward e-commerce, which has been ongoing since the late 1990s. This shift has accrued largely to Amazon.com, the pioneer in US e-commerce, with its share of e-commerce at roughly 40% (Amazon has a large third-party merchant business but does not disclose GMV, so its exact share is unknown).
The industry is fragmented, with the top 10 largest firms holding less than 30% market share, the 10th largest holding less than 1%, with a large amount of share held by over 500,000 small retail businesses. However, the top 10 largest firms have gained share (~2%, from 26.3% in 2X15 to 28.6% in 2X19).
Industry Structure and External Influences
Porter’s Five Forces is a commonly used framework of assessing industry structure that helps determine an industry’s long-run profitability.
| Force | Description |
|---|---|
| Threat of substitute products | If substitutes to a company’s products are easily available, then the threat is high and demand for the company’s products will decrease. Customers may switch to alternative products if switching costs are low. If this force is strong, it will weaken the pricing power of the market players. |
| Bargaining power of customers | Customers enjoy bargaining power in industries with large volumes and smaller number of buyers. The price competition and profitability is low as customers demand low prices. Ex: Airlines ordering numerous aircrafts from Boeing or Airbus. Since airlines typically order a large number of aircrafts, they have high bargaining power. |
| Bargaining power of suppliers | Suppliers enjoy pricing power in industries where suppliers are small and the supply of key inputs to a company is scarce. Ex: Consumer products companies have limited control over price. |
| Threat of new entrants | If barriers to entry are high, then the threat of new entrants is low. Ex: The threat of new entrants is high in the mobile handset market. |
| Intensity of rivalry among existing competitors | Industries with high fixed costs, high exit barriers, little differentiation in products, and similar size experience intense rivalry. Ex: Boeing and Airbus. |
1] Threat of New Entrants: Very High
Opening a retailer, especially an e-commerce retailer that utilizes third-party merchant services, is relatively easy and common. In the USA, retailers are the most common type of business formed—by a wide margin, with over 40,000 new firms filing formation papers each month. Customers can easily switch retailers, as most do not have an ongoing relationship such as a subscription fee or contract, and there are minimal regulatory barriers such as licenses and patents.
2] Threat of Substitutes: Low
Broadly speaking, the substitute for retail is consumer services, which also includes digital services. Most categories of goods, however, are not easily replaceable with services, or they enjoy a cost advantage because of lower labor intensity. There have been periods when services grew faster than goods, but as shown in an earlier exhibit, retail sales have grown essentially in line with US nominal output/income. Retail is arguably one of the oldest industries, and while it has evolved over time, it has yet to be replaced.
3] Bargaining Power of Customers: Moderate
Retail customers are highly fragmented, with each consumer representing a distinct decision-maker, as there are generally no group purchasing organizations. However, many products are sold by many retailers, and the internet has enabled easy comparison shopping at retailers. Customers are price sensitive with respect to identical products sold by different retailers.
4] Bargaining Power of Suppliers: Low to Moderate
Key suppliers for retailers include manufacturers of goods, employees, and lessors of retail or fulfillment space. In most cases, numerous options are available. However, branded goods are sold exclusively by a sole manufacturer that may impose high prices and other economic terms, like shelf space and visibility, and may want to sell only to certain retailers (e.g., makers of luxury goods may not sell to discount retailers in order to maintain exclusivity).
5] Rivalry among Existing Competitors: High
Given the sheer number of similarly sized firms selling similar or identical products, retailers compete fiercely, often with price promotions and discounts as price is one of the few ways they can lure customers away from competitors.
External Influences on Industry Growth
Apart from internal factors, it is also important to look at factors outside the industry that influence the industry’s profitability. A framework commonly used for this purpose is PESTLE analysis: political, economic, social, technological, legal and environmental influences.
- Political influences: Changing fiscal and monetary policy, government’s direct selling and purchasing activities, regulatory changes, and geopolitical conditions and actions.
- Economic influences: Demand for products and services are affected by overall economic activity at any point in time. Economic variables that affect an industry’s revenues and profits are:
- GDP
- Level of interest rates
- Inflation
- How easily money is available to businesses.
People cut down on discretionary spending during the festive/holiday season if inflation is very high (emerging economies), or if the economy is in a recession leading to job cuts.
- Social influences: How people work, spend their money and leisure time pursuing hobbies, and travel affect various industries. More women entering the workforce worldwide has spun many new industries, while boosting others → Restaurants, work wear for women, home and child care services, and demand for more cars are some of the effects of this trend.
- Technological influences: New technologies can rapidly change an industry or push them into the decline stage faster. Invention of the microchip and the evolution of the computer hardware industry, impact of digital imaging technology on the photographic film industry, USBs on DVD/CD, digital music on cassette player industry.
- Legal influences: Refers to changes in laws and regulations that alter an industry’s business practices. Examples of industries strongly affected by legal influences are tobacco, alcohol, and gambling.
- Environmental influences: Climate change poses a real threat to the growth and profitability of many industries. Public awareness about the environmental impact of livestock and protection of animal rights has been increasing. Many people are shifting towards healthier and plant-based diets.
Competitive Positioning
An analyst should assess a company’s competitive strategy along three dimensions:
- Does the strategy create a defense against the five industry forces?
- Does the strategy benefit from, or is at least not at odds with, the expected external industry influences identified in the PESTLE analysis?
- Does the company have the resources and capabilities to execute the strategy?
3 well known competitive strategies that have worked in a variety of industries are: cost leadership, differentiation, and focus.
| Cost Leadership | Differentiation | Focus | |
|---|---|---|---|
| Means of executing strategy | • Economies of scale from fixed costs • Favorable access to raw materials • Culture of strict cost control • Aggressive pricing to gain high volume • Low cost distribution • Economies of scope |
• Investments in ads, brand, customer service, proprietary distribution channels • Protection using trademarks, copyrights, patents • Superior quality, unique features • Culture of strong customer experience • Premium pricing • Integration of services, software, and hardware |
• Proximity to customers and strong understanding of their needs • May incorporate elements of strategy from both cost leadership and differentiation, but focused on particular group |
| Which of the 5 Forces it defends against | • Threat of new entrants: Capital requirements and scale advantages deter entrants • Bargaining power of customers: Customers can only bring prices down to the costs of the marginal producer, leaving margin for the cost leaders • Industry rivalry: Rivals may not be able to compete on price with cost leaders |
• Threat of new entrants and of substitutions: Customer loyalty to unique product can deter switching, protect market share • Bargaining power of customers: Customers may be unable to unwilling to comparison shop or switch • Bargaining power of suppliers: The company may have the ability to pass along price increases to customers and/or margin to absorb cost increases |
• Threat of new entrants and of substitutes: Customer loyalty to unique product can deter switching, protect market share • Bargaining power of customers: Customers may be unable or unwilling to comparison shop or switch |
| Industry appropriateness | • Capital intensive • Price-conscious customers • Customers do not value or notice pro-duct differences • Minimal innovation in industry |
• Price is not foremost concern for customers • Customers value distinctiveness • Innovation in industry, with products varying in features and forms |
• Difficult (or uneconomical) to serve customer group, product, or geography for other players |
| Risks to the strategy | • Cost inflation, loss of discipline • Technological change that results in loss of cost leadership or market share • Desire for premiumization among customers |
• Imitation by competitors • Buyers become sophisticated, no longer demand level of service • Pricing premium becomes high for customers to bear • May preclude high market as customers value exclusivity |
• Larger competitors outcompete on price • The differences in demand between the narrow group and industry as a whole narrow • Buyers become sophisticated, no longer demand level of service |