Company Analysis - Past and Present
Go to Equity Investments
Topics
Table of Contents
Introduction
An insightful and well written company research report can help investors understand a company and make good investment decisions about the company’s securities. This and the next two learning modules provide a framework to prepare a company research report.
This learning module covers:
- Elements of a company research report
- Determining a company’s business model
- Evaluating a company’s revenue and revenue drivers – including pricing power
- Evaluating a company’s operating profitability and working capital management
- Evaluating a company’s capital investments and capital structure
Company Research Reports
Exhibit 1 from the curriculum presents a framework for company and industry analysis.
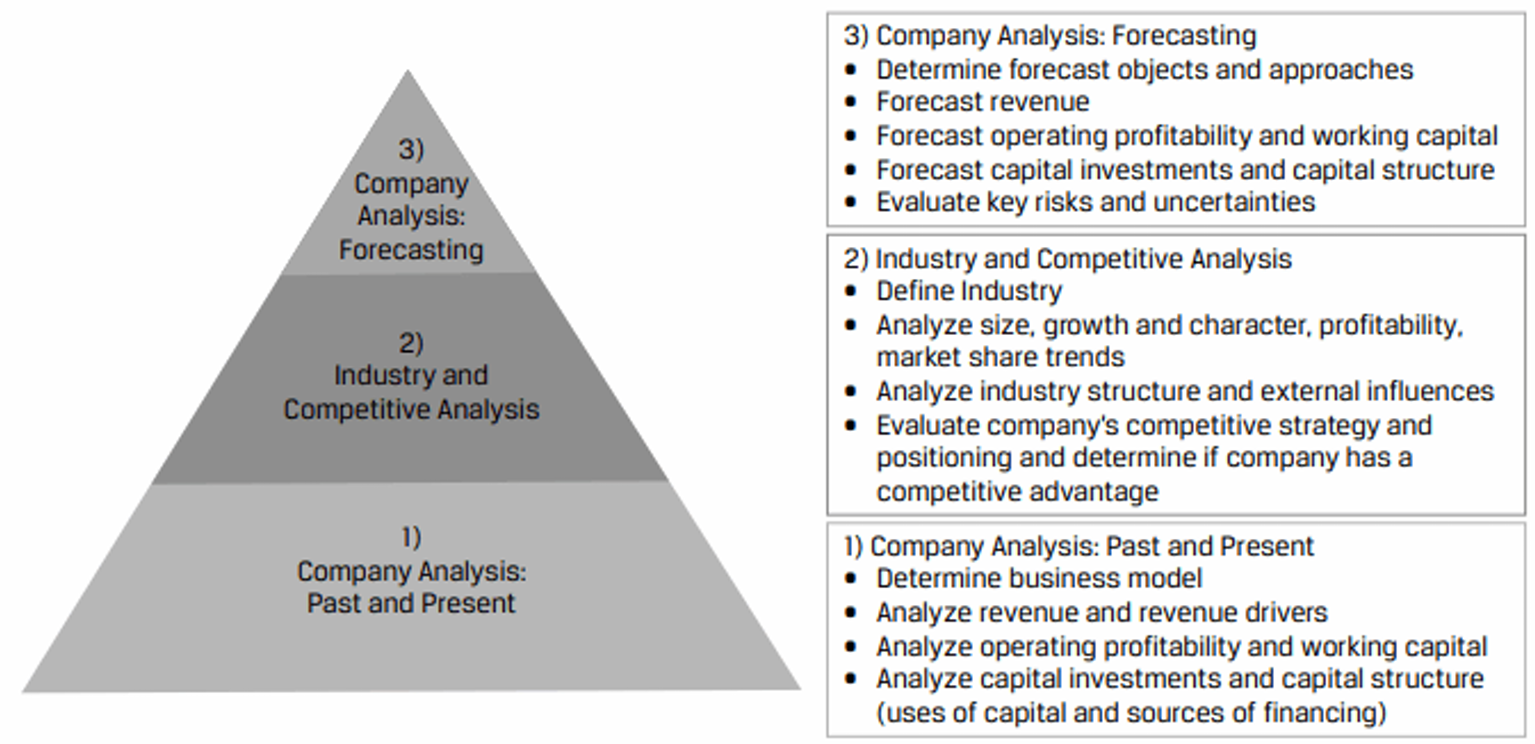
Company research reports examine a company’s past and present financial statements, as well as its industry and competitors, and forecast its future financial statements. Reports conclude with a valuation, an investment recommendation, and a discussion of investment risks.
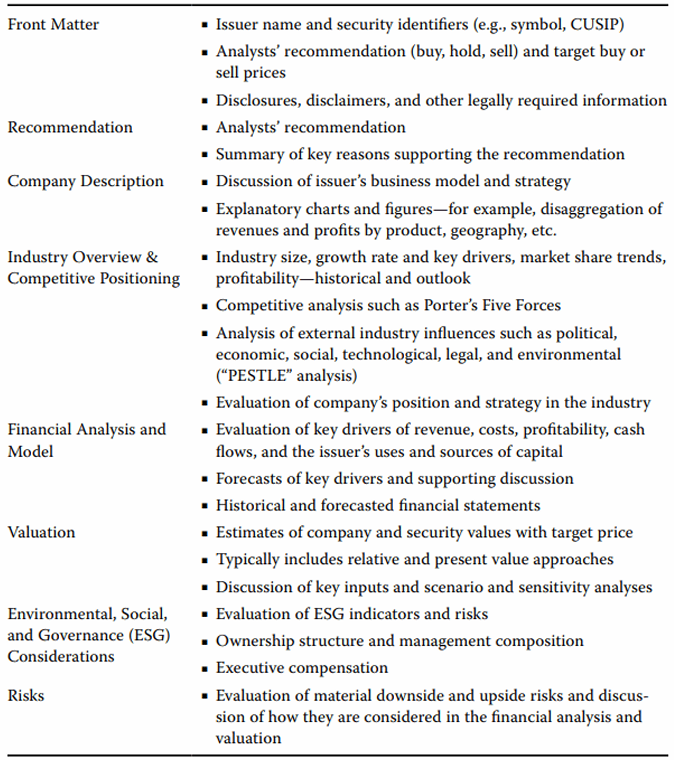
The structure content and tone of a research report can vary. For example, reports for distribution to external clients (a sell-side report) often consist of an extensive initial report. The primary audience of this report is those who are not already knowledgeable about the company.
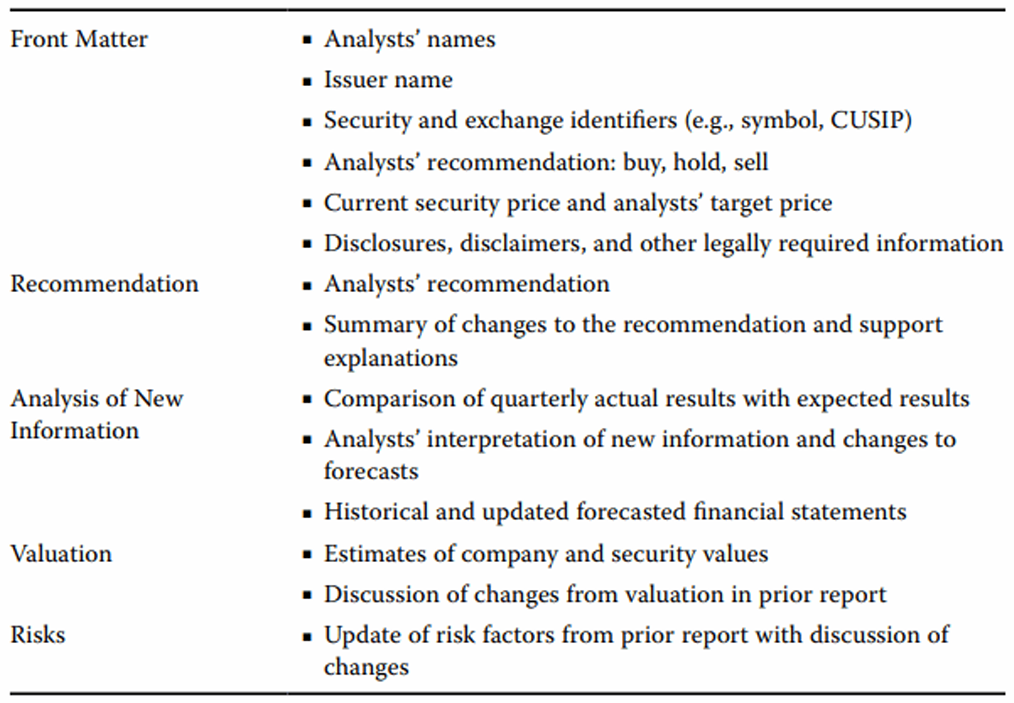
Subsequent company research reports are usually shorter than initial reports. Their primary audience consists of people who are already familiar with the company and need an update based on new information (such as a quarterly report) or a change in the analyst’s recommendation.
Determining the Business Model
The first step of company analysis is understanding the company’s business model. A business model describes the company’s operations and includes the elements listed below, which analysts investigate by answering several key questions.
| Biz Model Element | Key Q for Analysts |
|---|---|
| The product(s) or service(s) the company sells | What is the firm selling? |
| Customers and key customer groups | To whom does the company sell? |
| Sales channels, including customer acquisition and product/service delivery mechanisms | How does the company reach potential and current customers and how does it deliver products? |
| How the product(s) or service(s) are priced and paid for | How much does the company charge and how are prices and payment terms structured? |
| Resource, supplier, and partner relationships needed to operate effectively | What does the company buy and rely on? |
| To answer these questions, analyst rely on both issuer and third-party information sources. |
Issuer sources (available freely if the company is public)
- Regulatory filings, especially the annual and quarterly reports
- Quarterly or semi-annual earnings conference calls
- Presentations and events for investors
- Press releases
- Issuer management, investor relations, or other personnel
- Company website or properties that the analyst may be able to visit as either a customer or an investor
Public third-party sources
- Free industry white papers or analyst reports from a consultancy
- Economic or industry indicators from governments and other organizations
- General news outlets
- Industry-specific news outlets
- Social media
- Miscellaneous sources available via search engines
Proprietary third-party sources
- Analyst reports and communications, including from “sell-side” or “Wall Street” analysts and credit rating agencies
- Reports and data from platforms such as Bloomberg and FactSet
- Reports and data from consultancies, often industry specific, such as Rystad in energy, IQVIA and Evaluate in biopharma, Gartner and IDC in information technology
Proprietary primary research
- Surveys, conversations, product comparisons, and other studies commissioned by the analyst or conducted directly
Elaine Nguyen is an analyst at Fyleton Investments. To find investment candidates for one of Fyleton’s funds, Nguyen ran a screen for companies in developed markets that exceeded a certain level of sales growth and return on invested capital over the last five years while also performing well in the last recession. One company that passed the screen is Warehouse Club Inc. (“Warehouse”). Neither Nguyen nor her colleagues have ever worked on Warehouse before. A portfolio manager suggested that Nguyen research the company and its industry for several days and then discuss initial findings with colleagues before writing a formal research report.
Warehouse is a public company, so Nguyen compiles several issuer information sources, including the company’s latest annual report and a transcript of management’s presentation at a recent investor event. The following paragraphs and figures are excerpts from these sources.
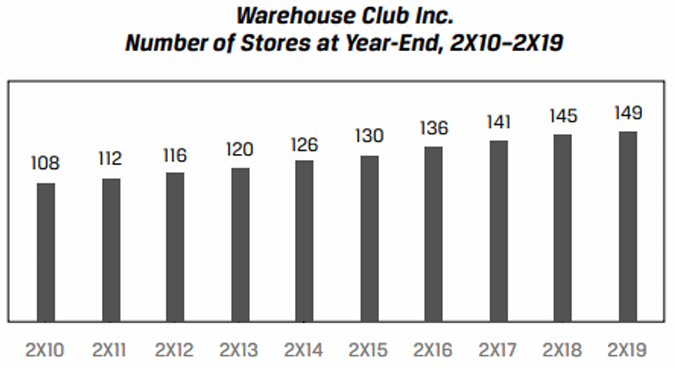
Warehouse Club Inc. (“we,” “our,” “us,” “the company”) is a leading discount retailer, consistently offering customers more than 20% savings on a broad range of food and other merchandise compared to supermarket, department store, convenience store, and e-commerce competitors. Warehouse operated 149, 145, and 141 stores as of 31 December 2X19, 2X18, and 2X17, respectively.
We sell a core assortment of packaged food and beverages, fresh foods, and non-food merchandise such as apparel, appliances, electronics and entertainment, housewares, and sporting goods. In addition to our core assortment, our stores feature a changing assortment of seasonal or discounted items based on the latest consumer trends and availability from suppliers, which vary by store. We also offer ancillary products and services such as petrol stations co-located with our stores, in-store takeaway prepared foods, pharmacy and optician centers, and hearing aids. In addition to carrying the leading branded goods, we also sell packaged food and household goods under our exclusive private label brand that we source from contract manufacturers, which account for over 15% of our net sales and carry higher than average profitability.
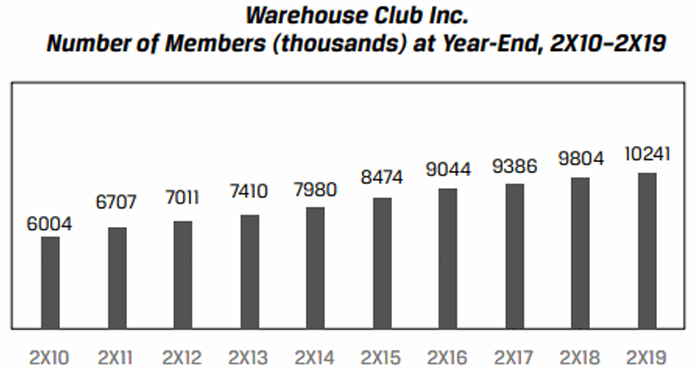
We operate a member-based model that requires customers to show their membership card to enter and shop in our stores. The annual membership fee is $60 per household. We estimate that members’ annual savings versus shopping at competitors for the same basket of goods amounts to over five times their annual membership fee. Our membership fee revenues were $601, $576, and $553 million in fiscal years 2X19, 2X18, and 2X17, respectively. Besides providing us with a source of recurring revenue, membership engenders shopper loyalty and drives our industry-low levels of inventory theft of less than 20 basis points as a percentage of net sales, which we believe is at least one-fifth that of competitors. Total memberships were 10.2, 9.8, and 9.4 million as of 31 December 2X19, 2X18, and 2X17, respectively.
Our strategy is based on price and cost leadership. We stock a limited selection of high-quality branded and private-label products in a wide range of categories that produce high sales volumes and rapid inventory turnover. We limit items to fast-selling models, sizes, and colors and carry an average of approximately 4,000 unique products per store, less than a quarter of the assortment of our supermarket and supercenter competitors. Most items are sold only in bulk sizes. Wherever possible, we utilize direct-from-manufacturer distribution and move merchandise immediately to the sales floor, presenting on pallets in a no-frills warehouse atmosphere.
Our high-volume purchases of a limited number of products, direct from manufacturer distribution, and reduced handling of merchandise enable us to hold a low-cost position in the retail industry in terms of merchandise and labor costs. Our low costs and membership fee revenues enable us to operate profitably while charging significantly lower prices than other retailers. Low prices for quality products drive greater membership and net sales over time, leveraging our selling, general, and administrative expenses, reducing them as a percentage of net sales.
Our stores operate on a seven-day, 70-hour week with predictable shifts for employees. Because the hours of operation are shorter than other retailers, and due to other efficiencies inherent in a warehouse-type operation, labor costs are lower relative to the volume of sales. We look to maintain a large base of full-time employees with above average wages and benefits to establish long tenures, as we believe this maximizes productivity and customer service at our stores. Our employee retention rate for employees who have been with us for at least a year is 90%, which we believe is substantially higher than the retail industry average.
Our retail operations, which represent substantially all our consolidated net sales, are our only reportable segment. We do not have significant sales outside our domestic geography: the United States. No single customer or supplier represents a material amount of revenues or merchandise costs, respectively.
 |
 |
 |
|---|
|
|
|
| ------------------------------------ | ------------------------------------ |
During its presentation at a recent investor event, Warehouse management made the following statements that were not in the annual report:
- 3 years ago, the company launched “Buy Online, Pick-Up in Store,” which enables members to shop on Warehouse’s website or mobile app and pick up their order, assembled by Warehouse employees, at a store. The company does not plan to offer e-commerce or delivery itself or through third-party services.
- Membership is $60 per year, paid upfront, and refundable on a prorated basis for days remaining in the year. Management has increased the price of membership every five years by $5 and expects to continue to do so. The last price increase was three years ago.
- Management intends to open four new stores per year for the next five years.
- The company operates stores in urban and suburban areas in a single country. Over 90% of current members live within 10 kilometers of a store, and while membership has grown around existing stores over time, management believes the primary driver of membership growth is opening stores in new areas.
- Management does not plan to open stores in another country for the foreseeable future. An immaterial amount of merchandise is imported.
What is the firm selling?
Warehouse sells a range of consumer goods, mostly consumables and perishables, approximately 4,000 unique items. For customers to shop at the stores, they must hold a membership, which Warehouse sells for $60 per year, per household. Nguyen graphs the following net sales by category data with descriptions supplied by Warehouse, and notes that the composition of net sales by category has not changed materially in the last 10 years.
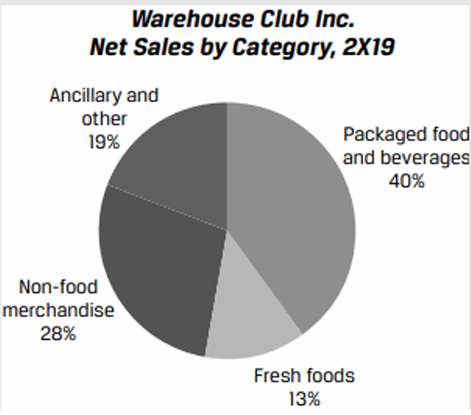
- “Non-food merchandise” includes a broad range of items such as appliances, electronics, health and personal care products, hardware, outdoor and sporting goods, jewelry, furniture, and housewares.
- “Ancillary and other” are service businesses that operate in or next to Warehouse’s stores and include takeaway prepared foods, prescription pharmacies, petrol stations, optician centers, and hearing aids.
To whom?
Warehouse’s members are primarily consumer households that live within 10 kilometers of a store, are value-conscious, are willing to forgo a more extensive selection for lower unit prices on bulk-sized goods, and are able to afford the annual membership fee.
How?
Warehouse sells products and services both in and around its stores. Members can either shop at the store or shop online and pick up at the store (Nguyen notes that management did not disclose the size of this in terms of net sales). Management said that it does minimal advertising (besides promotional mail) in an area before it opens a store and also sends out membership renewal reminders; the company primarily relies on word of mouth and its stores’ physical presence to drive interest and foot traffic.
Memberships can be purchased online, by phone, or at any Warehouse store.
Management said that over three-quarters of members purchase and renew their memberships online.
For how much?
Warehouse has two revenue streams: goods and services (for which it earns net sales) and membership (for which it earns membership fees). Management sets the prices of its merchandise by item. Gross margin and markup on aggregate net sales for the last three fiscal years were as follows:
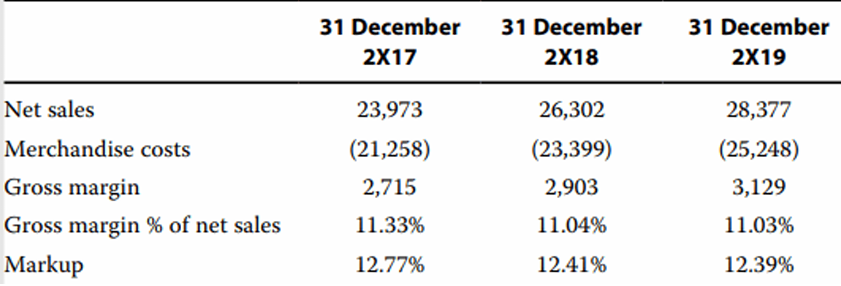
Therefore, the average good or service is sold at a price that is a little over 12% of the cost for Warehouse to purchase and ready the item for sale. While management claims that the company is a cost and price leader, Nguyen will have to corroborate that.
Membership is $60 per year, per household. Membership is required to shop at Warehouse stores, thus effectively raising the price of all its goods and services.
What does the company buy and rely on to operate effectively?
- Merchandise from a broad range of manufacturers and private-label goods from contract manufacturers
- Human capital in stores and in management
- Fixed assets including land in attractive locations, buildings, fixtures, refrigerators and freezers, and a range of information technology systems such as point-of-sale payment systems
- Credit and debit card payment networks and financial institutions to receive and make electronic payments
While these are all broadly available and the company has not had supply or service interruptions in the past, a key partner appears to be merchandise manufacturers, particularly those that manufacture Warehouse’s private-label products. Since Warehouse is strict on cost and quality and carries a limited selection, the company does rely heavily on these contract manufacturers.
In summary, Warehouse’s business model is aimed at creating a virtuous cycle whereby low prices drive memberships, which drive further sales, which drive negotiating leverage with suppliers to enable low prices at low costs.
Revenue Analysis
After understanding the company’s business model, an analysis of historical financial statements will help the analyst identify key drivers of revenues, profitability, cash flows, and financial position.
Key drivers are causative factors that explain the level of and changes in an output variable (e.g. revenues).
Revenue Drivers
Revenue analysis can be done using a bottom-up or top-down approach. A bottom-up approach breaks down revenues into drivers such as sales volumes and prices, by product line or segment. A top-down approach expresses revenue as a function of drivers such as market share, market size, and GDP growth. The two approaches are often used together.
Bottom-Up Approach to Revenue Analysis
Warehouse’s revenues are composed of net sales and membership fees. Based on her business model work, Nguyen knows that net sales are sales of merchandise and services in Warehouse stores (the company does not operate an e-commerce business). A logical driver of net sales each year, therefore, is the number of stores open that year. Nguyen decomposes Warehouse’s net sales into two drivers: the average number of stores open and net sales per average store. Nguyen also calculates the change in these drivers: the absolute change in stores each year (new-store openings; so far, Warehouse has never closed a store) and the annual percentage change in net sales per store.
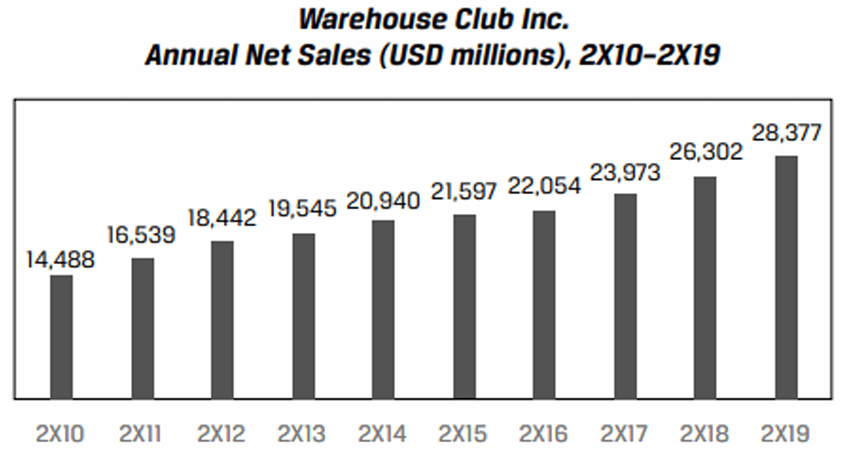
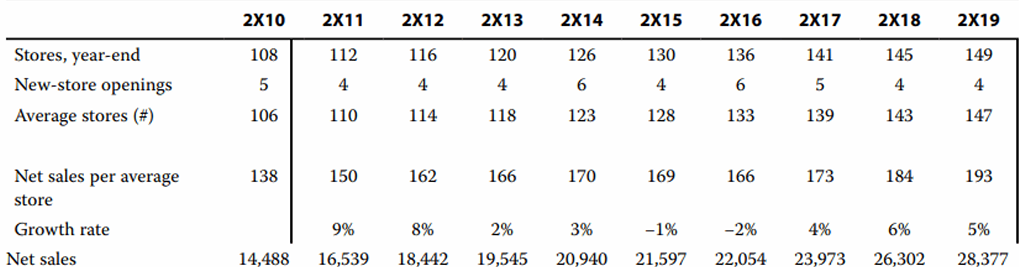Net sales in 2X19 were 96% higher than in 2X10, driven by similar growth contributions from the two drivers: the average number of stores increased by 39% and sales per average store increased by 40%.
An encouraging sign for forecasting this company’s results is that each driver appears relatively stable, indicating that they might be somewhat predictable. Sometimes, however, key revenue drivers are volatile, such as interest rates and oil prices for banks and oil producers, respectively. Volatility does not mean that the analyst has selected an incorrect driver; drivers are based on the business model.
Nguyen then decomposes Warehouse’s membership fee revenues into the annual price of membership and the average number of members.
Membership growth has been a larger driver of membership fee revenue growth than price increases, as the number of members has grown by 70% from 2X10 to 2X19 while prices have increased by 20% over the same period.
Management indicated that over 90% of members live within 10 kilometers of a store and, from 2X10 to 2X19, the company opened 46 new stores. Nguyen adds to her membership analysis by calculating the average number of members per store; if this number has been falling over time, it could mean that existing stores are losing members and sales to new stores the company opens, an example of cannibalization.
Not only has the average number of members per store not declined, but it has also grown by 19%, indicating no cannibalization and that new-store openings are not the only driver of membership growth. This is a positive sign, though Nguyen notes that additional analysis is needed to estimate a ceiling on the number of members a store can reasonably support, and to determine whether stores that opened many years ago have already hit this ceiling.
### Pricing Power --- Pricing power is defined as a company’s ability to set prices without affecting its sales volumes. Pricing power is primarily a function of market structure and a company’s competitive positioning in its market.Firms selling nearly identical products in highly competitive markets lack pricing power. The price is dictated by the overall market supply and demand, and all firms generally sell at the same price (i.e. they are price takers). Highly competitive markets usually don’t start that way, but rather become more competitive as new firms enter, the rate of innovation slows, and imitation spreads, a process known as commoditization.
Firms operating in less competitive markets (monopolistic competition, oligopoly, or monopoly) tend to have some pricing power. Analysts assess pricing power by comparing a firm’s prices with its costs, i.e. its profit margins.
Rising profitability over time is an important indicator of pricing power because it demonstrates that competitors, new entrants, or substitutes are not driving down prices faster than costs.
Top-Down Approach to Revenue Analysis
A government agency reports total national retail and food services sales each month for the country that Warehouse operates in (the United States). The data capture consumer spending at hundreds of thousands of retailers and restaurants. Sales are categorized by the type of retailer or restaurant, which reflects the primary type of product or service it sells. An excerpt of a monthly release is shown below:
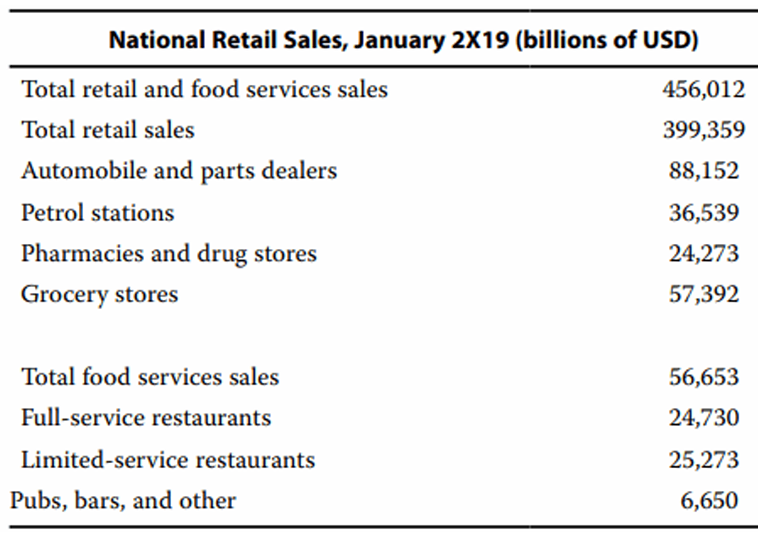Warehouse sells a broad range of retail goods in most cities, so US national retail spending is generally representative of Warehouse’s market size—the existing demand for goods or services offered by a company. By expressing Warehouse’s revenues as a percentage of the market, or its market share, over time, we can assess whether the company has been gaining or losing relevance with its customers relative to competitors and substitutes.
A challenge for analysts is determining market size. The data might be difficult to gather (not the case here), and judgment is required for determining what to include and exclude: only sales of products identical to the company’s, sales of similar products, all sales of competitors, and so on. The common practice is to include all sales of similar products and to consider substitutes separately (discussed in the next module on industry analysis). A substitute serves the same function as a product but differs in form (e.g., movie theater and streaming video, grocery stores and restaurants, print and digital advertising). This practice is subject to a wide range of opinions, however, and some analysts include sales of substitutes in market size estimates. The share of market that a firm does not have (i.e., 100% – x% market share) represents sales potential.
Elaine Nguyen decides to use total US retail sales as the market size for Warehouse, with one exclusion: automobiles and parts. Warehouse does not sell automobiles or automobile parts, nor does it sell substitute means of transportation or repair. Nguyen considers food service substitutes (restaurants and pubs) for Warehouse.
Nguyen makes three observations:
- The market is large and growth has been positive, albeit at a slow (3.4%) rate. This finding aligns with Nguyen’s expectations, because this is a developed market that represents a broad range of consumer spending (a large portion of which is for necessities) and the country has been in an economic expansion.
- Warehouse Club Inc. has a small (70 basis points in 2X19) but growing share of the market (up from 48 basis points in 2X10), indicating that its value proposition relative to other retailers has been resonating with consumers.
- Warehouse’s market share increased in most years, with the exception of 2X16, when its share was flat from the prior year. Nguyen will have to investigate further.
Operating Profitability and Working Capital Analysis
- Operating costs are costs incurred in generating current period revenue – for e.g., costs related to the production, sale and delivery of goods and services, the management of business activities etc.
- Investing costs are costs related to the acquisition and construction of long-term assets like property and equipment, patents, trademarks etc.
- Financing costs include payments to debt and equity investors e.g., dividend and interest payments.
Operating Costs and Their Classification
A company’s operating costs can be categorized in three ways: by their behavior with output, their nature, or their function.
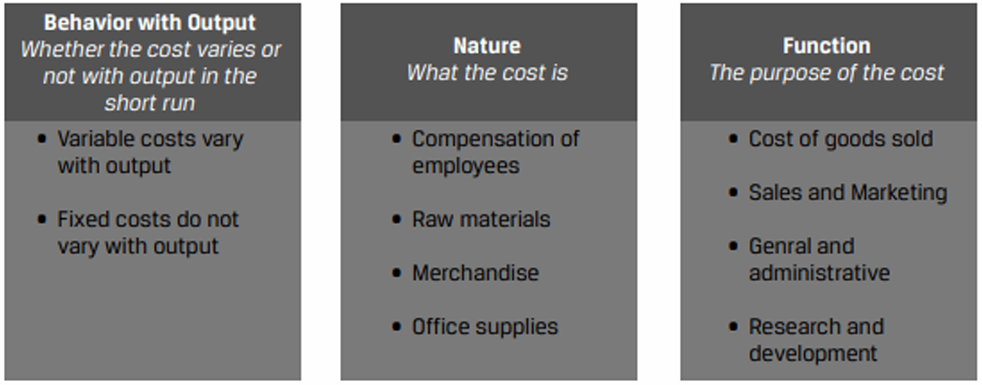
Behavior with Output: Fixed and Variable Costs
Based on whether the cost varies or not with output, operating costs can be categorized into fixed or variable costs. The proportion of fixed to variable costs in the total operating costs affects the stability and predictability of operating profit of a company.
Operating profit can be expressed as: $$[Q × (P −VC)] – FC$$where:
- Q = Units of outputs sold in a period
- P = Price per unit of output
- VC = Variable operating costs expressed per unit of output
- FC = Fixed operating costs stated on a total dollar, not per unit, basis
To be profitable, a company’s contribution margin (P – VC) must be positive, and Q must be high enough to exceed FC.
Degree of Operating Leverage (DOL): Operating leverage refers to the amount of fixed costs in the operating cost structure of a company. It represents both benefits and risks. If operating costs are largely fixed operating profit can increase rapidly with increases in Q. However, if Q declines, operating profit will also fall rapidly.
The degree of operating leverage measures the sensitivity of operating profit to changes in sales. $$DOL = \frac{\text{ Δ Operating Profit}}{ \text{Δ Sale}}$$
Natural and Functional Operating Cost Classifications and Measures of Operating Profitability
Instead of fixed and variable, IFRS and US GAAP require companies to disclose operating costs using either a natural or functional cost classification (most companies choose a functional cost classification). Because of this the income statements of different companies appear similar even though their business models may differ significantly.
Key profitability measures that can be calculated from the functional classification of operating costs:
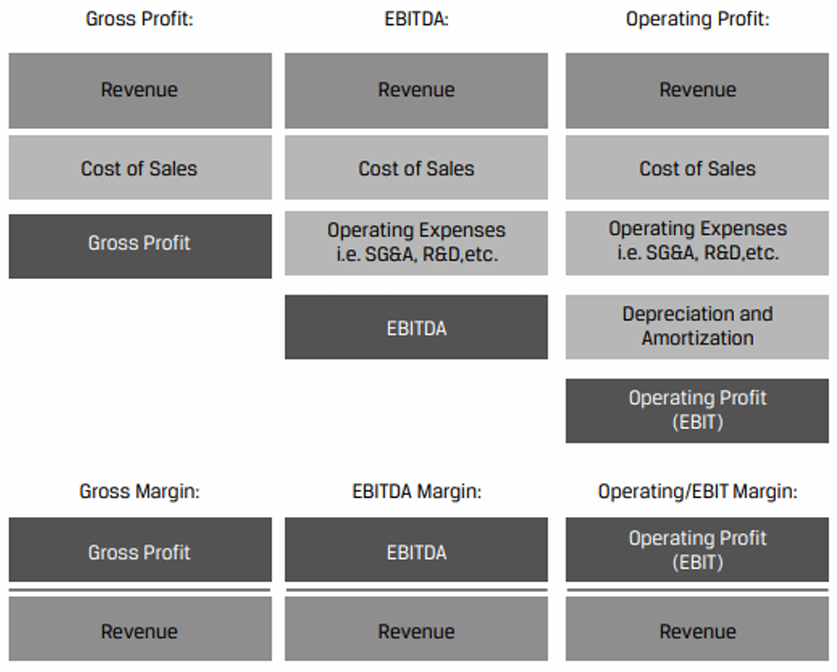
Apart from these profitability measures, additional considerations used in analysis are industry profitability (covered in the next LM), economies of scale, and economies of scope.
- Economies of scale refer to a decrease in costs per unit as output increases, which is typically the result of having fixed costs in the cost structure that are spread across more units of output.
- Economies of scope refer to a decrease in costs per unit as the number of product or business lines increases, and are typically the result of shared costs between product lines. E.g., a financial services firm offering consumer banking, brokerage, asset management, and payment processing services.
Operating Profitability Analysis
Warehouse Club Inc.’s operating costs are composed of merchandise costs (costs of sales), SG&A expenses, depreciation and amortization, and costs associated with opening new stores.
Based on her business model work, Elaine Nguyen believes the following about drivers for each of these operating costs.
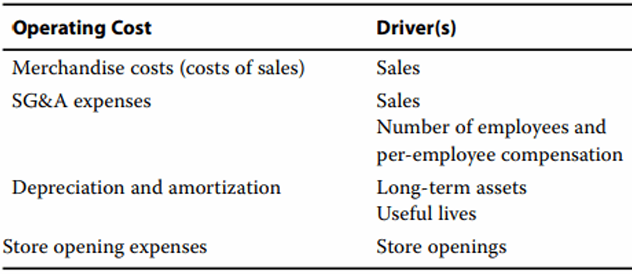
Based on these drivers, Nguyen calculates Warehouse’s gross margin (1 – cost of sales as % of net sales), SG&A expenses as a percentage of net sales, gross fixed assets to depreciation and amortization (implied useful life), store opening expenses per new-store opening, and, finally, profit margins. Profit margins include membership fee revenues.


Nguyen makes the following observations:
- Operating costs have increased significantly on an absolute basis from 2X10 to 2X19, but on a relative-to-sales basis have remained stable over the same period, indicating that the driver of the increase has been net sales growth.
- One exception is store opening expenses per store opening, which have quadrupled from 2X10 to 2X19, though in aggregate remain a small cost (less than 1/100 of SG&A expenses). Note that these are operating costs related to store openings, such as employee training before opening, not the investing cost of land and fixed assets.
- SG&A expenses do not appear to be fixed relative to net sales, as they have remained roughly the same percentage of net sales over time.
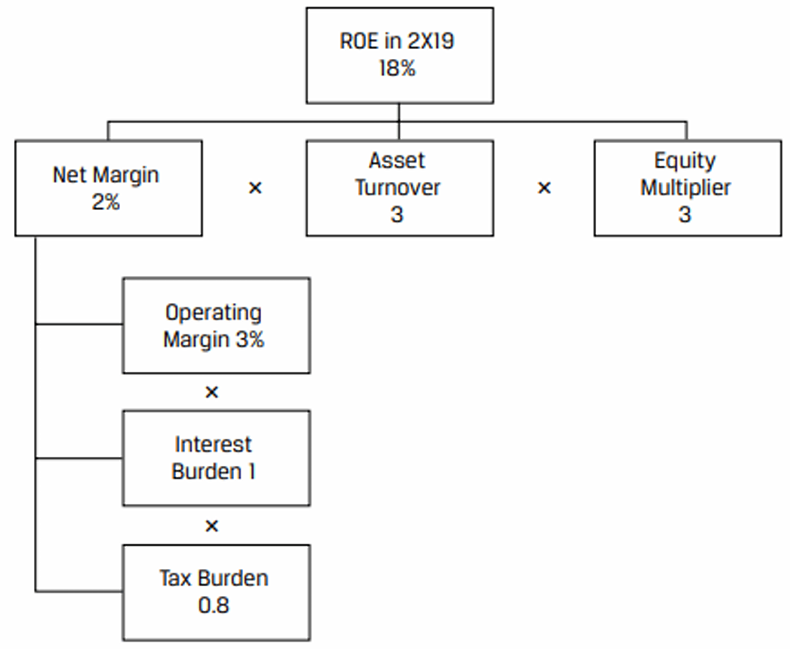
- Margins have remained mostly stable, though they did increase from 2X15 to 2X17 before coming back down in 2X18 and 2X19. Margins are low for Warehouse, with EBITDA and operating margins of 4% and 3%, respectively, in 2X19.
- The amount of operating profit is similar to the amount of membership fee revenues each year.
Nguyen creates the following chart:
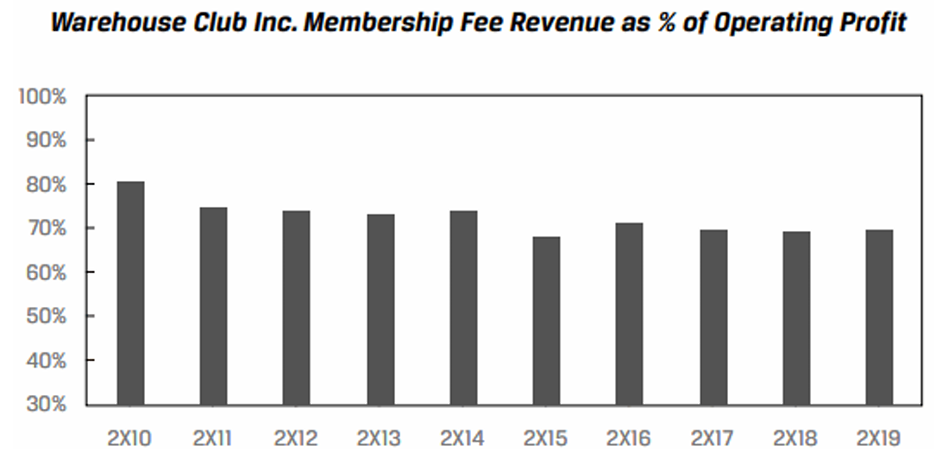
This chart implies that net sales from its stores—after deducting costs of sales, SG&A expenses, D&A, and store opening expenses—account for the remaining 30% of operating profit. This percentage is likely an understatement, since some amount of SG&A expenses is associated with membership fee revenues (marketing, customer service, payment processing, management), but it does align with Warehouse management’s assertion in its annual report that prices provide members with a significant return on membership: the company earns a thin margin on net sales, and it is membership fees that allow the company to run profitably.
Working Capital
The primary measures of a company’s working capital are its cash conversion cycle and the ratio of net working capital to sales.
A short cash conversion cycle means that company requires less external financing to fund operations.
The net working capital requirement refers to a minimum level of investment, in addition to capital investments, that cannot be distributed to investors. A negative net working capital means that suppliers are a source of financing for the company.
Working Capital Management
Elaine Nguyen calculates the working capital measures for Warehouse
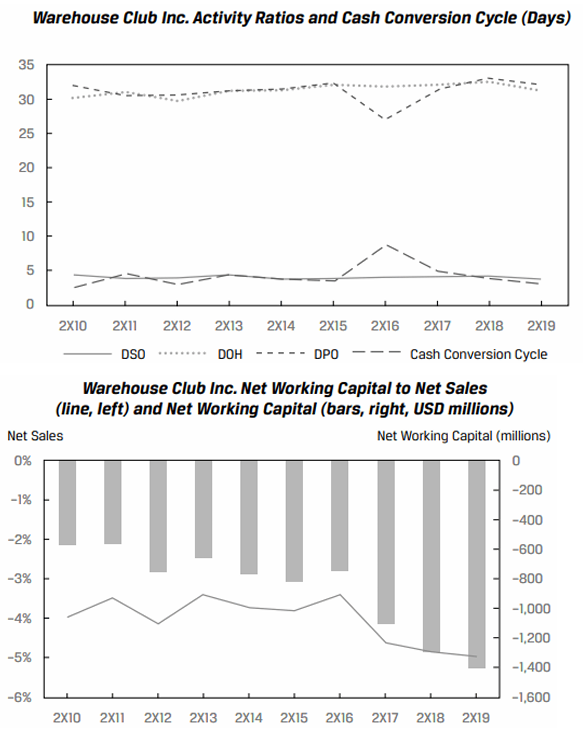
Nguyen makes the following observations:
- The cash conversion cycle is short, less than a week, primarily as a result of a DSO of 4, because Warehouse’s customers pay in cash or with credit or debit cards that settle in less than five business days, and days of inventory on hand is nearly equal to days payable outstanding, indicating that inventory is financed by suppliers.
- Net working capital is negative, now down to −5.0% of net sales, indicating that it is a source of financing for the company.
- Generally, all the activity ratios have been stable since 2X10, except for a one-year increase in 2X16 from a decline in days payable outstanding. Nguyen looked into this increase in the notes to the financial statements in a historical annual report. The company indicated that it changed accounting information systems in early 2X17 and made accelerated payments to suppliers at the end of 2X16, in advance of the system change in case there were problems.
Capital Investments and Capital Structure
Sources and Uses of Capital
An important part of company analysis is to determine whether a company creates economic value for its investors, i.e., whether the required rates of returns of debt and equity investors have been met or exceeded. To evaluate this, an analyst first needs to understand a company’s sources and uses of capital.
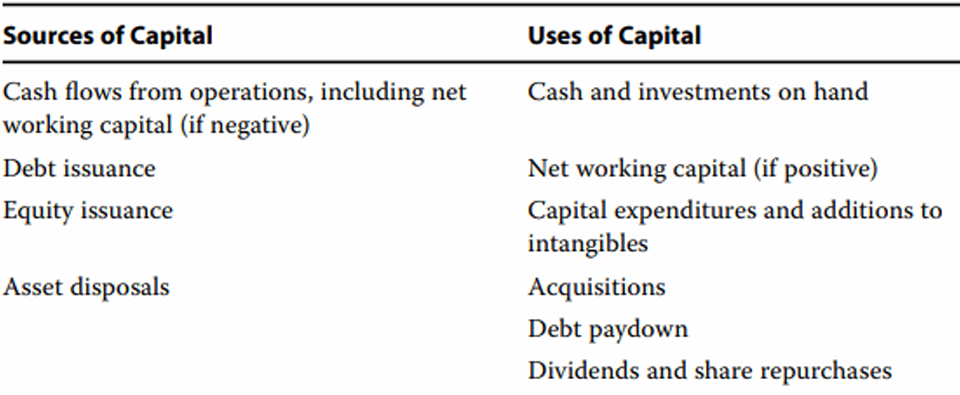
Sources and Uses of Capital
Elaine Nguyen calculates the following information on Warehouse over 2X10–2X19. Cash flows from operations include the effect of additional net working capital financing (i.e., Warehouse’s net working capital became more negative over time).
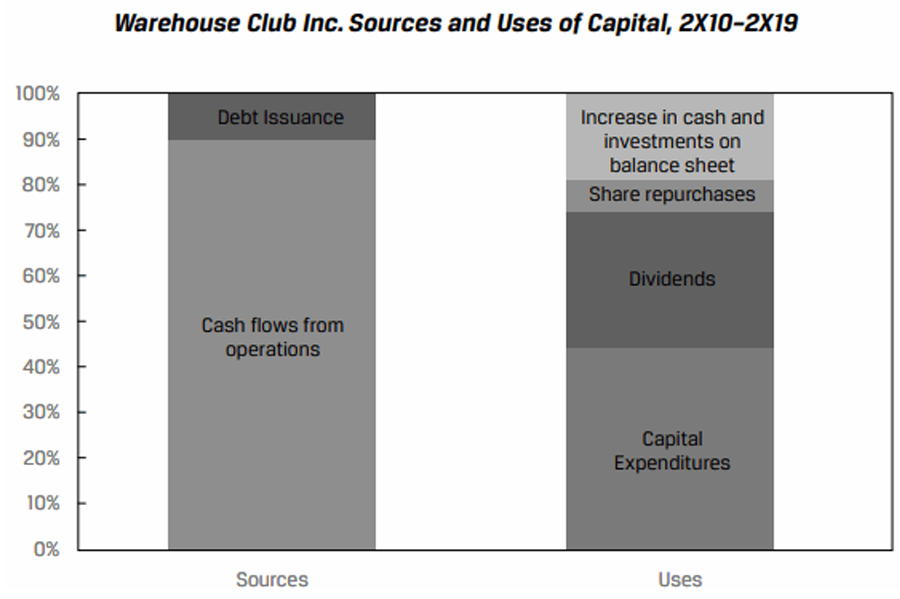
Nguyen makes the following observations:
- Capital expenditures and returns to shareholders (dividends and share repurchases) are almost equal, which is surprising considering that new-store openings performed well; Nguyen expected the company to devote a greater amount to capital expenditures for new stores.
- The company has made no acquisitions.
- Even after returns to shareholders, the company seems to prefer equity financing to debt financing. This preference is logical considering the company’s thin operating margin, though the fact that it primarily sells a wide range of necessities reduces its sales risks (i.e., from changes in the business cycle and in technology or fashion) and membership fees are a source of predictable income.
- The fact that debt issuance is smaller than the increase in cash and investments on the balance sheet indicates that the company’s net debt has decreased over time, implying a decline in financial leverage.
Evaluating Capital Investments and Capital Structure
The degree of financial leverage measures net income’s sensitivity to changes in operating income. The capital structure of the issuer is the primary driver of financial leverage.
Capital Investments and Capital Structure
Elaine Nguyen calculates the following information on Warehouse over 2X10–2X19. Additionally, the company’s interest coverage ratio (EBIT to interest expense) has been over 20 times and recently reached 30 times in 2X19, and the company’s credit is rated investment grade by major credit rating agencies.
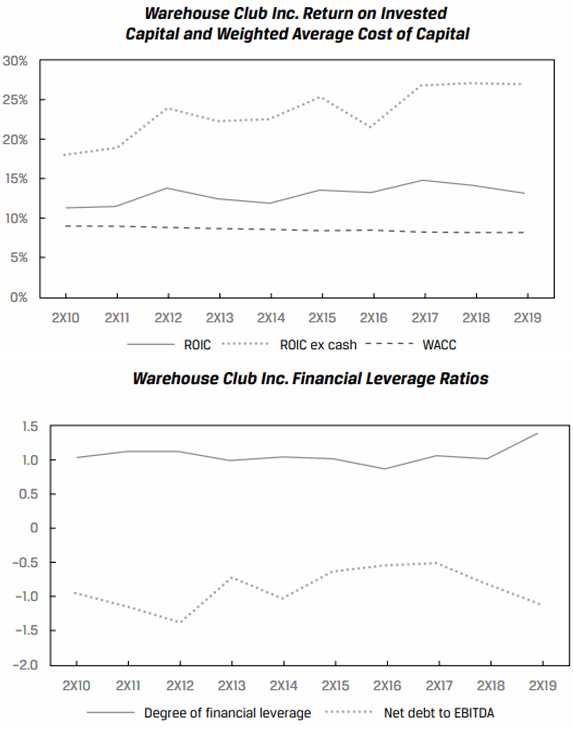
Nguyen makes the following observations:
- The company has created value for investors, with a spread of ROIC over WACC of 200–700 basis points since 2X10. WACC has declined slightly over time as interest rates have fallen; this calculation assumes a constant required rate of return on equity of 9%.
- The company’s returns on capital are far higher than its low operating and net margins would suggest, owing to its high asset turnover and negative net working capital as a low-cost means of financing from suppliers, requiring less capital from investors.
- The company has a conservative capital structure, with negative net debt and a degree of financial leverage close to 1.0 because interest expense is largely covered by interest income on cash holdings (i.e., net and operating income move together).
- The capital structure conservatism is evidenced in the counterfactual ROIC, which excludes cash and investments on the balance sheet. While an exaggeration (the company would need some cash on hand), ROIC could be almost 15 percentage points higher if the company reduced net cash by investing in value-creating projects or by returning capital.
ROIC or return on assets measures unlevered returns, these returns are modified by the financial leverage to produce levered returns – return on equity. ROE decomposition can be used as a comprehensive measure of a company’s profitability.