Financial Analysis Techniques
Go to Financial Statement Analysis
Topics
Table of Contents
Introduction
Financial analysis is a useful tool in evaluating a company’s performance and trends. The primary source of data is the company’s annual reports, financial statements, and MD&A. An analyst must be capable of using a company’s financial statements along with other information such as economy/industry trends to make projections and reach valid conclusions.
Financial Analysis Process
Before beginning any financial analysis, an analyst must clarify the purpose and context of why it is needed. Once the purpose is defined, an analyst can choose the right techniques for the analysis.
For example, the level of detail required for a substantial long-term investment in equities will be higher than one needed for a short-term investment in fixed income securities.
Objectives of the Financial Analysis Process
This learning module focuses on steps 3 and 4 of the financial analysis framework in detail:
- how to adjust financial statements
- compute ratios
- produce graphs and forecasts.
The processed data is then analyzed to arrive at a conclusion.
| Phase | Output |
|---|---|
| 1. Define purpose and context based on the analyst’s function, client input, and organizational guidelines. | - Objective - Questions to be answered - Nature and content of report to be provided - Timetable and budget |
| 2. Collect Data: Financial statements, other financial data, industry/economic data, discussions with management, suppliers, customers, and competitors. | - Organized financial statements - Financial tables - Completed questionnaires |
| 3. Process data | - Adjusted financial statements - Common-size statements - Ratios and graphs - Forecasts |
| 4. Analyze and interpret processed data | Analytical results |
| 5. Develop and communicate conclusions and recommendations | - Report answering questions - Recommendation regarding the purpose of the analysis |
| 6. Follow up | Updated recommendations |
Distinguishing between Computations and Analysis
An effective analysis is not just a compilation of various pieces of information, tables, and graphs. It includes both calculations and interpretations. For analyzing past performance, an analyst computes several ratios, compares them against benchmarks, evaluates how the company performed, and determines the reasons behind its good/bad performance. Similarly, for a forward-looking analysis, an analyst must forecast and make recommendations after analyzing trends, management quality, etc.
Analysts often present the findings of their analysis through a written research report. For example, a report might present the following:
- The purpose of the report
- Relevant aspects of the business context, including economic environment, financial and other infrastructure, legal and regulatory environment
- Evaluation of corporate governance and assessment of management strategy
- Assessment of financial and operational data, including key assumptions in the analysis
- Conclusions and recommendations, including limitations of the analysis and risks.
Analytical Tools and Techniques
Various tools and techniques such as ratios, common size analysis, graphs, and regression analysis help in evaluating a company’s performance. Evaluations require comparisons, but to make a meaningful comparison of a company’s performance, the data needs to be adjusted first. An analyst can then compare a company’s performance to other companies at any point in time (=cross-section analysis=) or its own performance over time (=time-series analysis=).
Financial Ratio Analysis
A ratio is an indicator of some aspect of a company’s performance like profitability or inventory management that tells us what happened, but not why it happened. Ratios help in analyzing the current financial health of a company, evaluate its past performance, and provide insights for future projections. Calculating ratios is straightforward, but interpreting them is subjective.
Uses of Ratio Analysis
Ratios allow us to evaluate:
- operational efficiency.
- financial flexibility.
- management’s ability.
- changes in company/industry over time.
- company performance relative to industry.
Limitations of Ratio Analysis
Ratio analysis also has certain limitations.
- Hetero (homo) - geneity of a company’s operating activities: Companies may have divisions that operate in a variety of industries. This can make it difficult to find comparable industry ratios.
- Need to use judgment: An analyst must exercise judgment when interpreting ratios. All ratios must be viewed relative to one another.
- Use of alternate accounting methods: Using alternate methods may require adjustments before the ratios are comparable.
- Nature of a company’s business: Companies may have divisions operating in many different industries. This can make it difficult to find comparable ratios.
- Consistency of results of ratio analysis: One set of ratios may indicate a problem, while the other may indicate the problem is short-term making the results inconsistent.
Sources of Ratios
Ratios can be computed using data obtained directly from companies’ financial statements or from a database such as Bloomberg, Thomson Reuters etc.
Analysts should be aware that the underlying formulas used to calculate ratios may differ by vendor. Analysts should determine whether any adjustments are necessary.
Similarly, data base providers may use judgement to classify items. For example, judgment may be used to classify income statement items as ‘operating’ or ‘non-operating’. Variation in such judgements would affect any computations involving operating income.
A good practice is the use the same source of data when comparing different companies.
Common Size Balance Sheets and Income Statements
Common-size financial statements are used to compare the performance of different companies within an industry or a company’s performance over time. They are prepared by expressing every item in a financial statement as a percentage of a base item.
Common-Size Analysis of the Balance Sheet
There are two types of common-size balance sheets: vertical and horizontal.
Vertical Common-Size Balance Sheet
A vertical common-size balance sheet is prepared by dividing each item on the balance sheet by the total assets for a period and expressed as a percentage. This highlights the composition of the balance sheet.
Horizontal Common-Size Balance Sheet
In a horizontal common-size balance sheet, each balance sheet item is shown in relation to the same item in a base year.
Notice that the base-year value for all balance sheet items is set to 1. This makes it easy to see the percentage change in each item relative to the base year. For the data given above, cash decreased by 10% and inventory increased by 10%. An analysis of horizontal common-size balance sheets highlights structural changes that have occurred in a business.
Common-Size Analysis of the Income Statement
A vertical common-size income statement divides each income statement element by revenue.
Cross-Sectional, Trend Analysis, and Relationships in Financial Statements
Time-Series Analysis
Trend analysis or time-series analysis provides information on historical performance and growth. It indicates how a particular item is changing – whether it is improving or deteriorating – relative to total assets over multiple periods.
Cross-Sectional Analysis
The vertical common-size balance sheet can be used in cross-sectional analysis (also called relative analysis) to compare a specific metric of one company with the same metric for another company or companies for a single time period. This method allows comparison across companies which might be of significantly different sizes and/or operate in different currencies.
Relationships in Financial Statements
Comparing the trend data of a horizontal common-size analysis across financial statements will give some insight into a company’s financial standing.
Consider the following percentage changes for a company to identify some potential issues:
- Revenue: +15%
- Operating income: +15%
- Operating cash flow: -10%
- Inventory: +60%
- Receivables: +40%
- Total assets: +30%
Some of the potential issues based on these numbers are:
- The assets are growing at a faster rate than revenue, which implies the company is spending more than the sales it is able to generate.
- Operating cash flow is negative whereas operating income is +15%, indicating a problem that the company is booking sales (accrual accounting) but has not realized the cash yet.
- Similarly, when inventory and receivables grow at a much faster pace than sales, it shows signs of poor inventory and receivables management.
The Use of Graphs and Regression Analysis
Graphs can be considered an extension of the financial analysis. It is a pictorial representation of the analysis done, be it ratio analysis or trend analysis. Analysts use appropriate graphs such as line charts and bar graphs based on the type of data to be shown. This helps in quick comparison of financial performance and structure over time.
Regression analysis, is a statistical method of analyzing relationships (correlations) between variables.
Common Ratio Categories, Interpretation, and Context
A large number of ratios are used to measure various aspects of performance. Commonly used financial ratios can be categorized as follows:
| Category | Measure |
|---|---|
| Activity ratios | Efficiency of a company in performing its day-to-day operations |
| Liquidity ratios | A company’s ability to meet its short-term obligations. |
| Solvency ratios | A company’s ability to meet its long-term obligations. |
| Profitability ratios | A company’s ability to generate profit from its resources. |
- Single statement ratios: Note that for some ratios, the numerator and denominator are from the same statement (Income statement, balance sheet, or cash flow statement). For example, net profit margin (net income/sales) where both items are from the income statement.
- Mixed ratios: For other ratios, the numerator is from one statement and the denominator is from another statement. An example is the asset turnover ratio (sales/assets) where the numerator is from the income statement and the denominator is from the balance sheet.
Interpretation and Context
As standalone numbers, the financial ratios of a company are not meaningful. The ratios are usually industry specific.
For instance, one cannot compare the ratios of Schlumberger with that of Facebook.
The financial ratios should be used to periodically evaluate a company’s past performance (trend analysis) and its goals and strategy; how it fares against its peers in the industry (cross-sectional analysis); and the effect of economic conditions on its business.
Activity Ratios
Activity ratios measure how efficiently a company manages its assets. They are also known as asset utilization ratios or operating efficiency ratios. The activity ratios usually have an element from the income statement in the numerator and one from the balance sheet in the denominator. The average of the balance sheet element is generally taken because the balance sheet only shows the value at the end of the period, whereas the income statement measures what happened during the period.
| Ratio | Formula | Interpretation |
|---|---|---|
| Inventory Turnover | - Indicates how many times per period the entire inventory was sold. - Measures the ability of a company to sell its inventory. - Higher number means greater efficiency because inventory is kept for a shorter period. It could also mean insufficient inventory, which in turn, might affect growth. |
|
| Days of Inventory on Hand | On an average, how many days of inventory is kept on hand. | |
| Receivables Turnover | - Indicates how quickly a company collects cash. - More appropriate to use credit sales instead of revenue but it is not readily available. - A higher number means greater efficiency in credit and collection. It could also mean stringent cash collection policies are hurting potential sales |
|
| Days of Sales Outstanding | - Elapsed time between credit sale and cash collection. - Higher number means it takes a long time to collect receivables. |
|
| Payables Turnover | - Indicates how quickly a company pays suppliers. - A high number means the company is paying suppliers quickly and is possibly not making use of credit facilities. - Low number may mean the company is facing trouble making payments on time and signal liquidity issues. |
|
| # of Days of Payables | On an average, how many days it takes to pay suppliers. | |
| Working Capital Turnover | - Indicates how efficiently a company generates revenue from working capital. - Working Capital = Current Assets (CA) – Current Liabilities (CL) - Higher number means greater efficiency. If CA = CL, then working capital would be zero making the ratio meaningless. |
|
| Fixed Asset Turnover | - Indicates how efficiently a company generates revenue from fixed assets. - A higher number means efficient use of fixed assets. - A lower number may mean inefficiency, or newer business (higher carrying value on B/S), or a capital intensive business. |
|
| Total Asset Turnover | - Indicates how efficiently a company generates revenue from total assets (fixed + current assets). - As with other turnover ratios, higher number means efficiency. |
|
| Purchases = Cost of Goods Sold (COGS) + Ending Inventory – Beginning Inventory |
- Name of the ratio indicates the balance sheet item.
- The income statement item is in the numerator.
- Average value of the balance sheet item is in the denominator. An income statement measures an item over a period but a balance sheet indicates values of items only at the end of a period. So, analysts typically use the average value for balance sheet items.
- Turnover ratios except inventory turnover and payables turnover use revenue in the numerator. Inventory turnover uses cost of goods sold, while payables turnover uses purchases.
- Higher number for turnover ratios = Greater efficiency
Liquidity Ratios
Liquidity ratios measure a company’s ability to meet short-term obligations. It also indicates how quickly it turns assets into cash.
| Ratio | Formula | Interpretation |
|---|---|---|
| Current Ratio | A higher number implies greater liquidity. | |
| Quick Ratio | - A higher number implies greater liquidity. - More conservative than current ratio as only more liquid current assets are included. |
|
| Cash Ratio | This is the most conservative liquidity ratio and a good measure of a company’s ability to handle a crisis situation. | |
| Defensive Interval Ratio | - Measures the number of days a company can operate before it runs out of cash. - A higher number implies greater liquidity. |
|
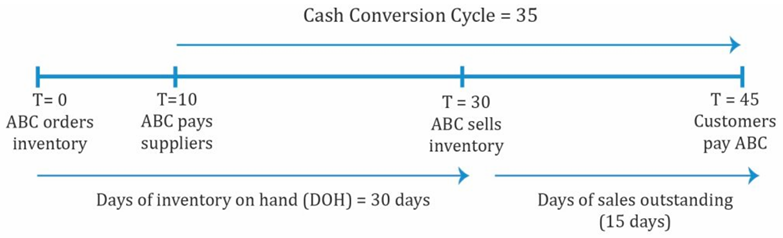
| Cash Conversion Cycle | Days of Inventory on Hand + Days of Sales Outstanding - No. of Days of Payables | - The time between cash paid (to suppliers) and cash collected (from customers). - A low number is better for the company as it means high liquidity. - A long cash conversion cycle implies low liquidity. |
 |
Solvency Ratios
Solvency ratios measure a company’s ability to meet long-term obligations. In simple terms, it provides information on how much debt the company has taken and if it is profitable enough to pay the interest on debt in the long term. It has to be analyzed within an industry’s perspective.
Certain industries such as real estate use a higher level of leverage.
| Ratio | Formula | Meaning |
|---|---|---|
| Debt to Assets | - Measures the amount of debt in total assets. - Higher debt means low solvency and higher risk. A ratio of 0.5 implies 50% of assets are financed with debt. |
|
| Debt to Capital | Capital = Debt + Shareholder's Equity | Measures the amount of debt as a percentage of capital. |
| Debt to Equity | Measures the amount of debt as a percentage of equity. | |
| Financial Leverage | - Measures the amount of assets per unit of equity. - A higher value means a company is more leveraged. |
|
| Debt to EBITDA | Estimates how many years it would take to repay total debt based on earnings before income taxes, depreciation and amortization (an approximation of operating cash flow). | |
| Interest Coverage | - Measures the company’s ability to make interest payments (how many times the company can make interest payments with its EBIT). - Unlike the other solvency ratios, a higher value for this ratio is better as it means stronger solvency |
|
| Fixed Charge Coverage Ratio | - Measures the ability of a company to pay interest on debt. - Here, lease payments are added to EBIT as they are an obligation like interest payments. Like the interest coverage ratio, a higher value for this ratio implies stronger solvency. - This ratio is a more meaningful measure for companies that lease a large portion of their assets. For example, airline companies. |
|
| Note that there are two categories of solvency ratios: debt (or leverage) ratios and coverage ratios. |
In general, a high debt (or leverage) ratio implies a high level of debt, high risk, and low solvency. With coverage ratios, a high number is good because this indicates high income relative to interest payments.
Profitability Ratios
Return on Sales
- Denominator is Revenue.
| Ratio | Meaning |
|---|---|
| Gross Profit Margin | A higher value means higher pricing and lower costs. |
| Operating Profit Margin | - Operating profit = Gross profit – Operating costs. - A good sign if operating profit margin grows at a faster rate than gross profit margin. |
| Pretax Margin | - EBT = Operating profit – Interest related expenses. - Needs further analysis if pretax income increases only because of non-operating income. |
| Net Profit Margin | Net profit = Revenue – All expenses |
Return on Investment
| Ratio | Formula | Meaning |
|---|---|---|
| Operating ROA | For return, either net income or operating income (EBIT) can be used | |
| Return on Assets | For return, either net income or operating income (EBIT) can be used | |
| Return on Capital | Like operating ROA, EBIT is used. Measures return on capital before deducting interest. | |
| Return on Equity | A very important measure of return earned on equity capital. Unlike return on common equity, it includes minority and preferred equity. | |
| Return on Common Equity | Money available to common shareholders. |
Integrated Financial Ratio Analysis
No single ratio or category of ratios in isolation can provide a good estimate of the overall position and performance of a company. Experience shows that information from one ratio category can be helpful in answering questions raised by another category. The most accurate overall picture comes from integrating information from all sources.
DuPont Analysis: The Decomposition of ROE
DuPont analysis decomposes a firm’s ROE to better analyze a firm’s performance.
- Start with ROE $$= \frac{\text{Net Income}}{\text{Equity}}$$
- The traditional DuPont equation is: $$ROE= \frac{\text{Net Income}}{\text{Sales}} \times\frac{\text{Sales}}{\text{Assets}}\times\frac{\text{Assets}}{\text{Equity}} $$$$\text{ROE = (Net profit margin) (Asset turnover) (Leverage ratio)}$$
- The extended DuPont equation is: $$ROE= \frac{\text{Net Income}}{\text{EBT}} \times\frac{\text{EBT}}{\text{EBIT}}\times\frac{\text{EBIT}}{\text{Revenue}}\times\frac{\text{Revenue}}{\text{Total Assets}}\times\frac{\text{Total Assets}}{\text{Total Equity}} $$$$\text{ROE= (Tax burden) (Interest burden) (EBIT margin) (Asset turnover) (Financial leverage)}$$
The following data is available for a company:
ROE → 19% 20% 22%
ROA → 8.1% 8% 7.9%
Total Asset Turnover → 2 2 2.1
Solution
A quick glance at the data says profitability is going up and asset turnover has slightly increased from 2010 to 2012.
- ROA is going down from the second year.
- ROE is going up (first row).
- Since ROA is going down, leverage must increase for ROE to increase.
- Since asset turnover is increasing, net profit margin has to decrease for return on assets to decrease.
Net profit margin has decreased but its financial leverage has increased.
Industry-Specific Financial Ratios
Ratios serve as indicators of some aspect of a company’s performance and value. Aspects of performance that are important in one industry may be irrelevant in another. These differences are reflected through industry-specific ratios.
For example, companies in the retail industry may report same-store sales changes because in the retail industry it is important to distinguish between growth that results from opening new stores and growth that results from generating more sales at existing stores.
Other examples of industry specific ratios include:
- Service companies: Revenue per employee, net income per employee
- Hotels: Average daily rate, occupancy rate
Model Building and Forecasting
Analysts use several methods to forecast future performance. One commonly used method is to project sales and to combine the forecasted sales numbers with expected values for key ratios.
For example, by using sales numbers and gross profit margin, one can determine cost of goods sold and gross profit. This method is particularly useful for mature companies with stable margins.
Besides ratio analysis, techniques such as sensitivity analysis, scenario analysis, and simulations are often used as part of the forecasting process.
- Sensitivity analysis shows a range of possible outcomes as specific assumptions or input variables are changed.
- With scenario analysis, a number of different scenarios are defined and outcomes are estimated for each outcome.
- Simulations involve the use of computer models and input variables which are based on a pre-defined probability distribution.