Cash Flows II
Go to Financial Statement Analysis
Topics
Table of Contents
Introduction
- Evaluating the sources and uses of cash
- Common size analysis
- Calculation of free cash flow measures
- Cash flow ratios
Evaluating Sources and Uses of Cash
Evaluation of the cash flow statement should involve the following:
- Where the major sources and uses of cash flow are between operating, investing, and financing activities. Major sources of cash for a company can vary with its stage of growth. E.g. Mature company → Operating activities
- Analyze whether operating cash flows are positive and cover capital expenditures for all companies.
- Primary determinants of operating cash flow.
- Compare operating cash flow with net income. If a company has large net income but poor operating cash flow, it may be a sign of poor earnings quality.
- Look at consistency of operating cash flows.
- Primary determinants of investing cash flow.
- How much is being invested for the future in property, plant, and equipment and how much is put aside in liquid investments.
- Primary determinants of financing cash flow.
- If the company is raising capital or repaying capital and which capital sources are being used.
Ratios and Common-Size Analysis
In common-size analysis of a company’s cash flow statement, there are two alternative approaches.
- Express each line item of cash inflow (outflow) as a percentage of total inflows (outflows).
- Express each line item as a percentage of revenue.
The common-size cash flow statement makes it easier to see trends in cash flow rather than just looking at the total amount. The second approach is useful for the analyst in forecasting future cash flows.
Free Cash Flow Measures
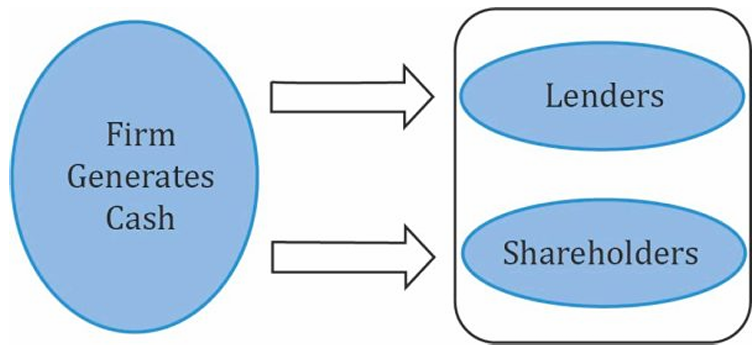
Free cash flow to firm (FCFF) is the cash flow available to all the suppliers of capital to a company after all operating expenses have been paid and necessary investments in working capital and fixed capital have been made. The suppliers of capital include both lenders (debt) and equity shareholders (equity).
The formula for computing FCFF from net income is: $$\text{FCFF = NI + NCC + Int (1 – Tax rate) – FCInv – WCInv}$$where:
- NI = Net Income
- NCC = Non-Cash Charges
- Int = Interest Expense
- FCInv = Fixed Capital Investment/Expenditures
- WCInv = Working Capital Expenditures
FCFF can also be computed from CFO as: $$\text{FCFF = CFO + Int(1 – Tax rate) – FCInv }$$
While FCFF indicates how much cash is available to all suppliers of capital, free cash flow to equity (FCFE) is the cash flow available to the company’s stockholders after all operating expenses and borrowing costs (principal and interest) have been paid and necessary investments in working capital and fixed capital have been made.
The formula for computing FCFE is as follows: $$\text{FCFE = CFO – FCInv + Net Borrowing}$$
Cash Flow Statement Analysis: Cash Flow Ratios
There are several ratios useful for the analysis of the cash flow statement. These ratios generally fall into cash flow performance (profitability) ratios and cash flow coverage (solvency) ratios.
Performance Ratios
| Ratio | Calc | Meaning |
|---|---|---|
| Cash Flow to Revenue | O Cash generated per $ of revenue | |
| Cash Return on Assets | O Cash generated per $ of asset investment | |
| Cash Return on Equity | O Cash generated per $ of owner investment | |
| Cash to Income | Cash generating ability of operations | |
| Cash Flow Per Share | O Cash Flow on a per share basis. |
Coverage Ratios
| Ratio | Calc | Meaning |
|---|---|---|
| Debt Coverage | Financial risk and financial leverage | |
| Interest Coverage | Ability to meet interest obligations | |
| Re Investment | Ability to acquire assets with CFO | |
| Debt Payment | Ability to pay debts with CFO | |
| Dividend Payment | Ability to pay dividends with CFO | |
| Investing and Financing | Ability to acquire assets, pay debts, and make distributions to owners |