Balance Sheets
Go to Financial Statement Analysis
Topics
Table of Contents
Introduction
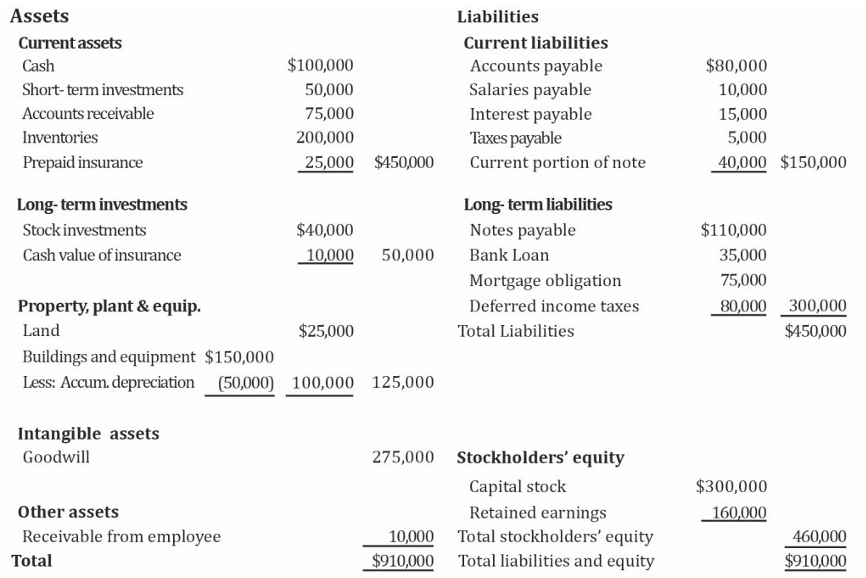
The balance sheet presents the financial position of a company on a particular date, in terms of three elements: assets, liabilities, and equity.
- Assets (A) are what the company owns. They are the resources controlled by the company as a result of past events and they are expected to provide future economic benefits.
- Liabilities (L) are what the company owes. They represent the obligations of a company arising from past events, the settlement of which is expected to result in a future outflow of economic benefits from the entity.
- Equity (E) represents the owners’ residual interest in the company’s assets after deducting its liabilities. It is also known as shareholders’ equity. The accounting equation for determining equity is: E = A – L.
Limitations in Financial Analysis
- Some assets and liabilities are measured based on historical cost while some are measured based on fair value, which represents its current value as of the balance sheet date. These differences can have significant impact on reported figure.
- The value of an item reported on the balance sheet is the value at the end of the reporting period. If we are analyzing the company at a later date, these values may have changed.
- Some assets and liabilities are difficult to quantify and are not reported on the balance sheet. For example, brand, customer loyalty, human capital, etc.
Current assets are those assets that are expected to be used up or converted to cash within one year or in one operating business cycle, whichever is greater. When the entity’s normal operating cycle cannot be clearly identifiable, its duration is assumed to be one year.
Current liabilities are those liabilities which are expected to be settled within one year or in one operating business cycle, whichever is greater.
This learning module covers the financial reporting and disclosure requirements related to:
- Intangible assets
- Goodwill
- Financial instruments
- Non-current liabilities
Finally, we will also learn how to analyze a balance sheet using financial ratios and common-size analysis.
Intangible Assets
Intangible assets refer to identifiable non-monetary assets that lack physical substance. Examples include patents, licenses, and trademarks.
IFRS allows companies to report intangible assets using either a cost model or a revaluation model. US GAAP allows only the cost model.
- For each intangible asset, a company determines whether its useful life is finite or indefinite.
- An intangible asset with a finite useful life is amortized on a systematic basis over the best estimate of its useful life. The amortization and useful life estimate is reviewed at least annually.
- The principles of impairment for an intangible asset with a finite useful life are the same as for property, plant and equipment (PP&E).
- An intangible asset with an indefinite useful life is not amortized. Instead, it is tested for impairment at least annually.
Intangible Assets Developed Internally
Costs to internally develop intangible assets are generally expensed when incurred, although there are exceptions.
For internally developed intangible assets, there are two phases: the research phase and the development phase.
- Research phase refers to the period during which commercial feasibility of an intangible asset is yet to be established. It is defined as “original and planned investigation undertaken with the prospect of gaining new scientific or technical knowledge and understanding.”
- Development phase refers to the period during which the technical feasibility of completing an intangible asset has been established with the intent of either using or selling the asset.
The treatment for the two phases varies slightly under IFRS and US GAAP as outlined below:
- Under IFRS:
- Research costs are expensed.
- Development costs can be capitalized if technical feasibility and the intent to sell the asset are established.
- Under US GAAP:
- Both research and development costs are expensed.
Intangible Assets Purchased Externally
In contrast to internally created intangibles, acquired or purchased intangible assets are capitalized and reported as separately identifiable intangibles as long as they are based on contractual rights (such as a licensing agreement), other legal rights (such as patents), or can be separated and sold (such as a customer list).
Goodwill
Goodwill is an unidentifiable intangible asset. It is created when one company is purchased by another company. If the purchase price is greater than fair value at acquisition, then the excess amount is recognized as an asset on the acquirer’s balance sheet and referred to as goodwill.
Company A buys Company T for $100 million. The book value of Company T’s assets and liabilities are $125 million and $75 million respectively. The fair value of Company T’s assets and liabilities are $160 million and $75 million respectively. What is the goodwill?
In this case, the purchase price is $100 million and the net fair value is $160 – $75 million = $85 million. Hence, goodwill is ($100 million – $85 million) $15 million.
Note that the book values of assets and liabilities are not used in the goodwill calculation.
Under both IFRS and US GAAP, goodwill is capitalized (i.e., shown as an asset on the balance sheet). Goodwill is not amortized but is tested for impairment annually. If goodwill is impaired, it is written down and the impairment loss is shown on the income statement.
The recognition and impairment of goodwill can have a significant impact on the comparability of financial statements between companies.
Therefore, analysts often make adjustments to remove the impact of good will such as:
- Excluding goodwill from balance sheet used to compute financial ratios
- Excluding goodwill impairment losses from income data used to examine income trends.
Financial Instruments
IFRS defines a financial instrument as a contract that gives rise to a financial asset of one company and a financial liability or equity instrument of another entity.
Financial assets include stocks and bonds, derivatives, loans and receivables.
Financial assets can be measured either at fair value or amortized cost. The measurement basis depends on how financial asset is categorized.
The major categories for financial assets are:
IFRS vs US GAAP
- Measured at Cost or Amortized Cost: If the asset’s cash flows occur on specified dates and consist solely of principal and interest, and if the business model is to hold the asset to maturity. For example, investment in a long-term bond. Unrealized gains and losses are not recorded anywhere.
- Measured at Fair value through Profit or Loss (FVTPL) or Held-for-Trading: This category of asset is acquired primarily for the purpose of selling in the near term and is likely to be held for only a short period of time. Unrealized gains and losses are shown in the income statement.
- =Measured at Fair value through Other Comprehensive Income (FVTOCI)= or Available-for-Sale: This category of asset is expected neither to be held till maturity nor traded in the near term. Unrealized gains and losses are shown in other comprehensive income. Unlike IFRS, the US GAAP category available-for-sale applies only to debt securities and is not permitted for investments in equity securities.
Realized gains for all categories are shown on the income statement of the company. An important concept related to these assets is mark-to-market. It is the process whereby the value of a financial instrument is adjusted to reflect current value based on market prices.
Company owners contribute $100,000, which is invested in a 20-year bond with a 5% coupon paid semi-annually. After six months, the company receives the first coupon payment of $2,500. At this stage, the market price has increased to $102,000. Show the balance sheet and income statement treatment under each of the three categorizations.
| | FVTPL | FVTOCI | Amortized Cost |
| -------------------- | ---------- | ---------- | -------------- |
| Balance Sheet | | | |
| Unrealized Gains | 2000 | 2000 | |
| RE | Up by 4500 | Up by 2500 | Up by 2500 |
| OCI | | Up by 2000 | |
| Income Statement | | | |
| Unrealized Gain | 2000 | | |
(B)
- Cash → 2500
- Cost of Securities → 100,000
- PIC → 100,000
(I) Interest Income → 2500
Non Current Liabilities
All liabilities that are not classified as current are considered to be non-current or long-term liabilities.
- Long-term financial liabilities – Include loans, notes and bonds payable. These are usually reported at amortized cost on the balance sheet.
If a company issues $10 million in bonds at 97.50% of par value (i.e., at a discount to par), the bonds will be reported as a
- Liability of $9.75 million on the date of issue.
- $250,000 discount will be amortized over the bond’s life
- Deferred tax liabilities – Arise from temporary timing difference between a company’s taxable income and reported income. They are defined as the amounts of income taxes payable in future periods due to temporary taxable differences.
Ratios and Common Size Analysis
Common-Size Analysis of the Balance Sheet
Balance sheet analysis can help us evaluate a company’s liquidity and solvency. A balance sheet can be used to analyze a company’s capital structure and ability to pay liabilities.
In a vertical common-size balance sheet, all balance sheet items are expressed as a percentage of total assets. Common-size statements are useful in comparing a company’s balance sheet composition over time (time-series analysis) and across companies in the same industry.
Balance Sheet Ratios
- Balance sheet ratios are those involving balance sheet items only.
- Liquidity ratios tell us about a company’s ability to meet current liabilities
- Solvency ratios tell us about a company’s ability to meet long-term and other obligations. They also help us evaluate a company’s financial risk and leverage.
Liquidity ratios have the same denominator → Current Liabilities
- Current = Current Assets
- Quick = Cash + Marketable Securities + Receivables
- Cash = Cash + Marketable Securities
Solvency ratios
-
Long Term Debt to Equity
-
Debt to Equity
-
Total Debt to Assets
-
Financial Leverage =
-
Ratio analysis requires judgment. They are sensitive to end of period financing and operating decisions that can potentially impact current asset and current liability amounts.
-
Also, evaluate ratios in the context of a company’s industry. This requires an examination of the entire operations of a company, its competitors, and the external economic and industry setting.