Calculating and interpreting the weighted-average cost of capital (WACC) for a company
Factors affecting capital structure
Modigliani–Miller propositions regarding capital structure
Optimal and target capital structure
The Cost of Capital
Cost of capital is the rate of return that the suppliers of capital require as compensation for their contribution of capital. Assume a company decides to build a steel plant and needs money or capital for it. Investors such as bondholders or equity holders will lend this capital to the company. Suppliers of capital will be motivated to part with their money for a certain period of time if the money invested can earn a greater return than it would earn elsewhere. In short, investors will invest if the return (IRR) is greater than the cost of capital.
A company has access to several sources of capital such as issuing equity, debt, or instruments that share characteristics of both debt and equity. Each source becomes a component of the company’s funding and has a specific cost associated with it called the component cost of capital.
The cost of capital is the rate of return expected by investors for average-risk investment in a company. Investors will demand a higher rate of return for higher-than-average-risk investments. Similarly, investors will demand a lower rate of return for lower-than-average-risk investments.
One way of calculating this cost is to determine the weighted average cost of capital (WACC), which is also called the marginal cost of capital . It is called marginal because it is the additional or incremental cost a company incurs to issue additional debt or equity.
Three common sources of capital are common shares, preferred shares, and debt. WACC is the cost of each component of capital in the proportion they are used in the company.
In other words, the value of a company is determined solely by its cash flows, not by the relative reliance on debt and equity capital.
The weighted average cost of capital (WACC) is unaffected by the capital structure$$WACC = w_d r_d + w_p r_p + w_e r_e$$We can explain MM’s capital structure irrelevance proposition in terms of a pie. Depending on the capital structure, the pie can be split in any number of ways, but the size of the pie will remain the same.
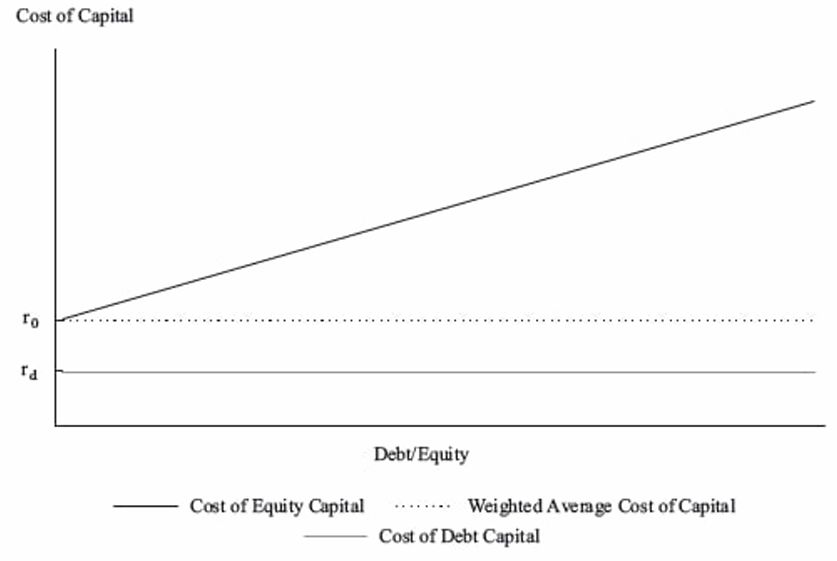
Higher Financial Leverage Raises the Cost of Equity (MM Proposition II without Taxes)
The cost of equity is a linear function of the company’s debt-to-equity ratio. $$r_e =r_o +(r_o– r_d ) D/E$$where:
is the cost of capital for a company financed only by equity and has zero debt
is the cost of debt
is the cost of equity
D/E = debt-to-equity ratio
As D/E rises, i.e. the company increases the use of debt, the cost of equity () rises. We know from MM Proposition I that the value of a company is unaffected by changes in D/E and the WACC remains constant.
Proposition II then implies that the cost of equity increases in such a manner as to exactly offset the increased use of cheaper debt in order to maintain a constant WACC. Under this proposition, WACC is determined by the business risk of the company, and not by the capital structure.
As leverage increases, the cost of equity increases, but WACC and the cost of debt remain constant.
Firm Value with Taxes (MM Proposition I with Taxes)
As interest paid is tax deductible, the use of debt provides a tax shield that increases the value of a company. If we ignore the costs of financial distress and bankruptcy, the value of the company increases as we take on more debt.
The value of a levered company is equal to the value of an unlevered company plus the value of the debt tax shield. $$V_L =V_U + tD $$where:
= value of the levered firm
= value of the unlevered firm
t = marginal tax rate
D = value of debt in the capital structure
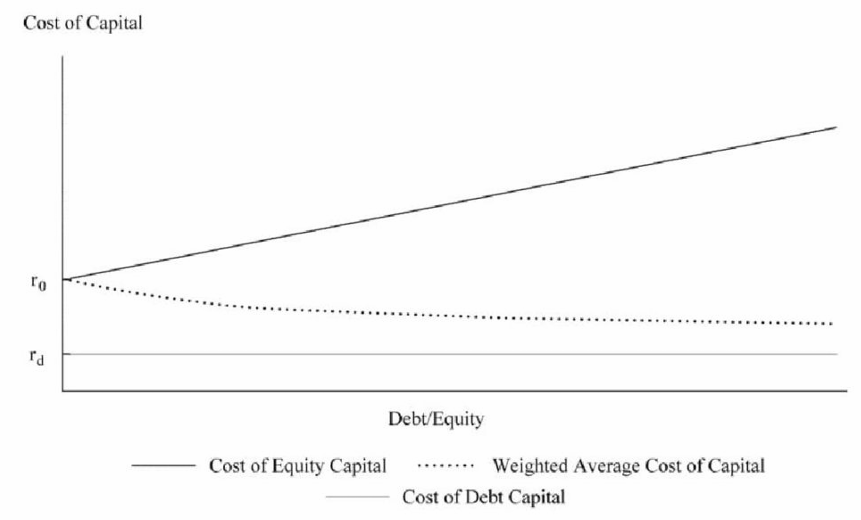
Cost of Capital (MM Proposition II with Taxes)
The cost of equity is a linear function of the company’s debt-to-equity ratio with an adjustment for the tax rate.
The cost of equity increases as the company increases the amount of debt in its capital structure, but the cost of equity does not rise as fast as it does in the no tax case.
WACC for a leveraged company falls as debt increases, and therefore the overall company value increases.
This proposition implies that in the presence of taxes (but no financial distress or bankruptcy costs), the use of debt is value enhancing and, at the extreme, 100% debt is optimal.
W/o Taxes
With Taxes
Proposition I
Proposition II
Cost of Financial Distress
The disadvantage of operating and financial leverage is that earnings are magnified downward during economic slowdown. Lower or negative earnings put companies under stress, and this financial distress adds costs to a company.
The costs of financial distress can be classified into direct and indirect costs.
Direct costs include the actual cash expenses associated with the bankruptcy process, such as legal and administrative fees.
Indirect costs include forgone investment opportunities, impaired ability to conduct business, and agency costs associated with the debt during periods in which the company is near or in bankruptcy.
The costs of financial distress are lower for companies whose assets have a ready secondary market. For example, airlines, shipping companies etc.
The probability of financial distress and bankruptcy increases as the degree of leverage increases. The probability of bankruptcy depends, in part, on the company’s business risk. Other factors that affect the likelihood of bankruptcy include the company’s corporate governance structure and the management of the company.
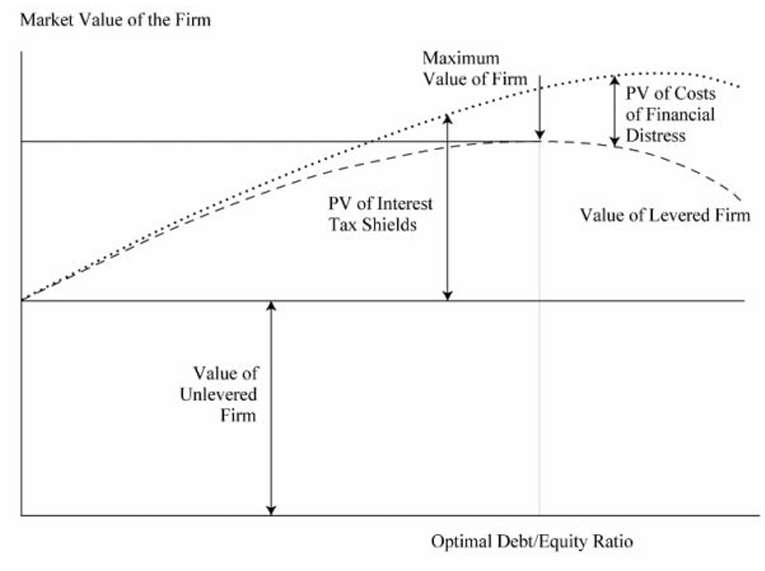
Optimal Capital Structure
We now consider a scenario that includes both corporate taxes and the costs of bankruptcy/financial distress.
The optimal capital structure is the one at which the value of the company is maximized. The static trade-off theory is based on balancing the expected costs from financial distress against the tax benefits of debt service payments.
Considering both the tax shield provided by debt and the costs of financial distress, the expression for the value of a leveraged company becomes: $$V_L = V_U + tD – PV(\text{Costs of financial distress})$$This equation represents the static trade-off theory of capital structure. It results in an optimal capital structure where debt is less than 100%.
At low levels of debt, the tax benefits of debt outweigh the PV of financial distress, and the firm’s value increases. However, as more debt is added, the PV of financial distress begins to rise.
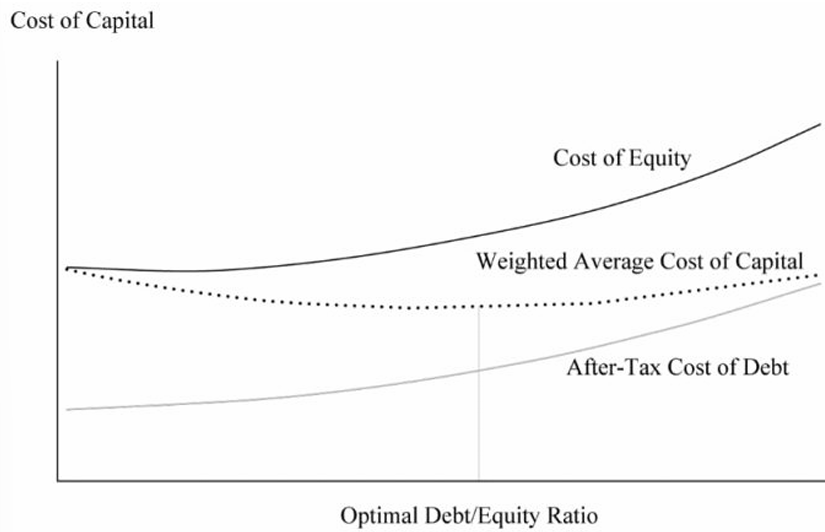
At the optimal debt/equity ratio point, the PV of financial distress is equal to the tax benefit of debt, and the firm value is maximum.
If more debt is added beyond this point, the PV of financial distress outweigh the tax benefits of debt, and the firm’s value decreases.
WACC is minimum at the point where the firm value is maximized.
When a company identifies its most appropriate capital structure, it may adopt this as its target capital structure. However, a company’s capital structure may vary from its target because management may try to take advantage of short-term opportunities in alternate financing sources. Market value variations also continuously affect the company’s capital structure. Sometimes, it may be impractical and expensive for a company to maintain its target structure.
In practice, it is difficult to precisely determine the optimal capital structure, because of the difficulty in estimating some costs, such as the costs of financial distress. Therefore, managers often use an optical capital structure range instead of a precise ratio. For example, instead of saying exactly 40% debt is optimal, managers can say debt should be in the range of 30% to 50%.
Market Value vs. Book Value
The optimal capital structure should be calculated using the market value of equity and debt.
However, company capital structure targets often use book values instead because:
Market values can fluctuate a lot and they do not necessarily impact the appropriate level of borrowing. For example, a company that has seen a rapid share price increase may decide to take advantage of this situation and issue even more equity instead of debt.
The management is primarily concerned with the amount and types of capital invested ‘by’ the company and not ‘in’ the company. Their perspective is different from investors who have purchased securities at the prevailing market price.
Lenders and rating agencies typically focus on the book value of debt and equity for their calculation measures.
Financing decisions are often opportunistic. Managers consider the share price of their company as well as market interest rates for their debt when deciding when, how much, and what type of capital to raise.
Target Weights and WACC
When conducting an analysis if we know the company’s target capital structure, then we should use it in our analysis. However, analysts typically do not know a company’s target capital structure. It can be estimated using one of these methods:
Assume the company’s current capital structure, at market value weights for the components, represents the company’s target capital structure.
Examine trends in the company’s capital structure or statements by management regarding capital structure policy to infer the target capital structure.
Use averages of comparable companies’ capital structures as the target capital structure.
Example
Estimating the Proportions of Capital
Market value of debt: EUR 50 million
Market value of equity: EUR 60 million
Primary competitors and their capital structures (in millions):
Calculate the proportions of debt and equity, if the target capital structure is calculated based on:
The current capital structure
Competitor’s capital structure
The company’s announcement that a debt-to-equity ratio of 0.7 reflects its target capital structure.
1:
2:
3: A debt-to-equity ratio of 0.7 represents a weight on debt of 0.7/1.7 = 0.4118, so w = 0.4118 and w = 1 − 0.4118 = 0.5882.
Pecking Order Theory and Agency Costs
Managers have more information about a company’s performance and prospects than outsiders, such as owners and investors. This is referred to as information asymmetry. Investors demand higher returns when asymmetry of information is high because this increases the probability of agency costs.
Investors closely watch manager’s decision for insights into the company’s future prospects. Managers may provide information to investors (“signaling”) through their choice of financing method. Fixed payment commitments, for example, can indicate management’s confidence in the company’s future prospects.
Being aware of this, managers take into account how their actions might be interpreted by outsiders.
Pecking Order Theory: This theory suggests that managers choose methods of financing that send the least signal to outsiders.
The preferred hierarchy for financing is:
Internal financing (retained earnings)
Debt financing
Equity financing
Agency Costs: Agency costs are incremental costs that arise from conflicts of interest between managers, shareholders, and bondholders. Agency theory predicts that as the use of debt increases, agency costs to equity will decrease. The more financially leveraged a company is, the less freedom managers have to incur additional debt or waste cash in inefficient ways.
Free Cash Flow Hypothesis: As per this hypothesis, high debt levels discipline managers by forcing them to manage the company efficiently so that the company can make its interest and principal payments. Thus, by reducing the company’s free cash flows, managers have fewer opportunities to misuse cash.