Capital Investments and Capital Allocation
Go to Corporate Issuers
Topics
Table of Contents
Introduction
Capital investments are investments with a life of one year or more. Companies make capital investments to generate value for their shareholders.
Capital allocation is the process by which companies make capital investment decisions. Capital allocation is important because it impacts a company’s future.
- Types of capital investments – going concern, regulatory/compliance, expansion, and other projects
- Steps in a typical capital allocation process
- Basic investment decision criteria – NPV, IRR, and ROIC
- Principles of capital allocation and common capital allocation pitfalls
- Types of real options – timing, sizing, flexibility, and fundamental options
Capital Investments
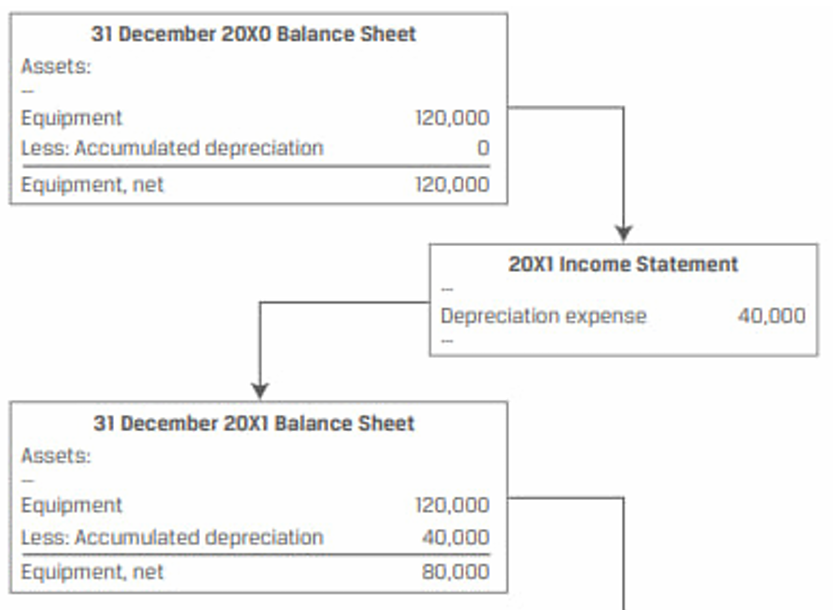
Capital investments are shown on the balance sheet as long-term assets. A portion of the cost is recorded on the income statement periodically as a non-cash depreciation or amortization expense over the asset’s useful life. In subsequent periods, the amount on the balance sheet is shown on a net basis, i.e., initial cost – accumulated depreciation. The net value declines to zero or a salvage value at the end of the asset’s useful life.
Types of Capital Projects
Companies invest for two primary reasons – to maintain their existing business and to grow it.
Projects undertaken by companies to maintain the business include:
- Going concern projects: Projects necessary to continue current operations and maintain existing size of the business or to improve business efficiencies.
- Machine replacement, infrastructure improvement
- Regulatory/Compliance projects: Projects typically required by a third party, such as the government regulatory body, to meet specified safety and compliance standards.
- Factory pollution control installation, performance bond posting to guarantee satisfactory project completion
Projects undertaken by companies to expand the business include:
- Expansion projects: Projects that expand business size and typically involve greater degrees of risk and uncertainty than going concern projects.
- New product or service development, merger, acquisition
- Other projects: Projects, which include high-risk investments and new growth initiatives, that are outside the company’s conventional business lines.
- Exploration investment into a new innovation, business model, or idea
Going Concern Projects
- Projects necessary to continue current operations and maintain existing size of the business or to improve business efficiencies.
- Most common going concern projects are replacing assets that have reached the end of their useful life, and maintaining IT hardware and software.
- Typically, these projects do not increase revenues but they could help a company save costs.
- They are fairly easy to evaluate as compared to the other projects.
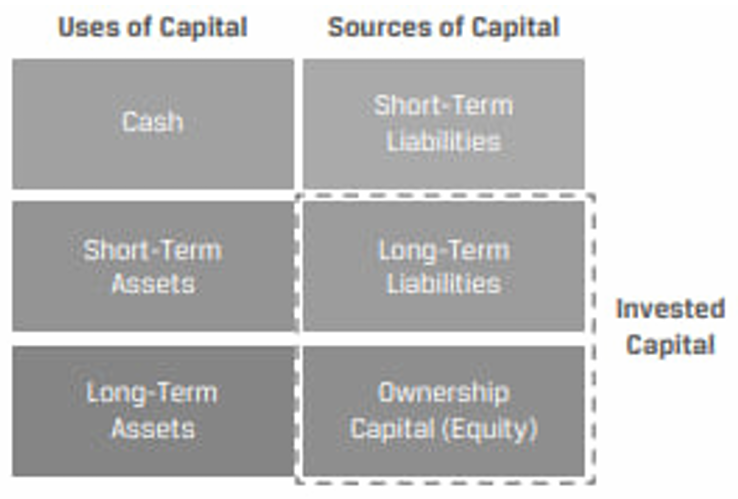
- To fund these projects, managers often try to match the financing with the life-span of the asset. For example, issuing a 20-year bond to fund an asset with an expected life of 20-years.
- If a company finances long-term assets with short-term financing, it faces rollover risk – the short-term financing costs could go up.
- If a company finances short-term assets with long-term financing, it faces the risk of overpaying in financing costs.
- To estimate the amount of capital spending on going concern projects, analysts often look at the depreciation and amortization expense reported on the income statement.
Regulatory Compliance Projects
- Projects typically required by a third party, such as the government regulatory body, to meet specified safety and compliance standards.
- These projects are unlikely to increase revenue; in fact, they may increase compliance costs. However, regulatory/compliance costs can act as barriers to entry and protect the industry’s profitability.
- While evaluating these projects, management must determine whether the business will still be profitable after considering the additional compliance costs.
- In most cases, companies will accept these projects and pass on the additional cost to customers.
- However, sometimes the cost may be too high and the company may decide that it is better off ceasing operations or shutting down the part of the business that is subject to the new regulation.
Expansion of Existing Business
- Projects that expand business size and typically involve greater degrees of risk and uncertainty than going concern projects.
- Some industries such as pharmaceuticals and oil and gas spend heavily (over 10% of revenues) on expansion projects.
- If internal opportunities for expansion are limited, managers may pursue acquisitions. However, the two main risks in acquisitions are the risk of overpaying and the difficulty in integrating the acquirer’s business operations.
New Lines of Business and Other Projects
- Projects, which include high-risk investments and new growth initiatives, that are outside the company’s conventional business lines.
- These projects are often observed in privately held companies or public companies under the control of a founding owner/significant shareholder.
- These projects tend to have a venture capital element to them. There will probably be a complete loss of investment, but if successful the project could be highly profitable.
Capital Allocation
Capital allocation is the process used by an issuer’s management to make capital investment decisions.
Steps in Capital Allocation Process
The steps in the capital allocation process are as follows:
- Idea generation: Investment ideas can come from anywhere within the organization, or outside (customers, vendors, etc.).
What projects can add value to the company in the long term? - Investment analysis: Gathering information to forecast cash flows for each project and then computing the project’s profitability.
Output: A list of profitable projects. - Planning and prioritization: Do the profitable projects fit in with the company’s long-term strategy? Is the timing appropriate?
Some projects may be profitable in isolation but not so much when considered along with the other projects. Scheduling and prioritizing of projects are important. - Monitoring and post-investment review: Post-investment review helps in assessing how effective the capital budgeting process was.
How do the actual revenues, expenses, and cash flows compare against the predictions?
Post-investment review is useful in three ways:
- If the predictions were optimistic or too conservative, then it becomes evident here.
- Helps improve business operations. Puts the focus on out-of-line sales and costs.
- Helps in identifying profitable areas for fresh investments in the future, or scale down in non-profitable ones.
Two widely used analytical tools in the investment analysis step are NPV and IRR.
Net Present Value (NPV)
Net present value is the present value of the future after tax cash flows minus the investment outlay.
ROIC reflects how effectively a company’s management is able to convert capital into after-tax operating profits.
Note that the numerator excludes interest expense because it represents a source of return to providers of debt capital, and the denominator includes sources of capital from all providers.
If the ROIC measure is higher than the cost of capital (COC), the company is generating a higher return for investors compared with the required return, thereby increasing the firm’s value. We can also say that projects with positive NPV will have a ROIC that is greater than the COC.
Assume that a company reported 24,395 in Year 2 after-tax operating profits and the following balance sheet information.
| | End of Yr 1 | End of Yr 2 | |
| ----------------- | ----------- | ----------- | --- |
| Cash | 4,364 | 6,802 | 1 |
| Short Term Assets | 40,529 | 52,352 | 2 |
| Long Term Assets | 287,857 | 279,769 | 3 |
| Acc Payable | 35,221 | 50,766 | 4 |
| Short Term Debt | 21,142 | 5,877 | 5 |
| Long Term Debt | 112,257 | 106,597 | 6 |
| Share Capital | 15,688 | 15,688 | 7 |
| Retained Earning | 148,442 | 159,995 | 8 |
Average LT liabilities and equity = 6 + 7 + 8
Therefore, ROIC = 8.73%
Capital Allocation Principles and Pitfalls
Capital Allocation Principles
The key principles of capital allocation are:
- Decisions are based on after-tax cash flows: Decisions are not based on an accounting/accrual basis (net income or operating income) which subtract non-cash charges such as depreciation. Shareholder value increases only on the cash that they have earned. Hence, any tax expenses must be deducted from the cash flows.
- Measure incremental cash flows: What incremental cash flows occur with the investment as compared to without it? Also sunk costs are excluded, while externalities are included.
- Exclude sunk costs: A sunk cost is one that has already been incurred and cannot be changed. For example, already incurred costs like preliminary consulting fees should not be included in the analysis
- Include externalities: Both positive/negative externalities should be considered in the analysis. Cannibalization is an example of a negative externality. For example, negative impact of a new diet soda product launch on the sales of existing soda products.
- Timing of cash flows is crucial: Due to the time value of money, cash flows received earlier are more valuable than cash flows received later.
Capital Allocation Pitfalls
Common capital allocation pitfalls can be divided into cognitive errors and behavioral biases.
Cognitive errors include calculation and other mistakes, while behavioral biases include errors in judgment and blind spots.
Cognitive Errors in Capital Allocation
- Internal forecasting errors: Companies may make errors in their internal forecasts. The errors could be related to incorrect costs or discount rate inputs.
- Overhead costs such as management time, IT support, and financial systems can be difficult to estimate.
- Incorrectly treat sunk costs and missed opportunity costs; and incorrectly use the company’s overall cost of capital, cost of debt, or cost of equity rather than the investment’s required rate of return in their analysis.
- Ignoring costs of internal financing: Many managers consider internally generated capital to be “free” and allocate it according to a budget that is heavily correlated with prior period amounts. Externally raised capital, on the other hand, is regarded as “expensive” and is used sparingly, typically only for large investments.
- Ideally, managers should view all capital as having an opportunity cost, regardless of source.
- Inconsistent treatment of, or ignoring inflation: Capital allocation analysis can be done either in ‘nominal’ terms or ‘real’ terms.
- Nominal cash flows include the effects of inflation.
- Real cash flows are adjusted downward to remove the effect of inflation.
Behavioral Biases in Capital Allocation
- Inertia: The amount of capital investment in a business segment/unit for a year is highly correlated to the amount spent in the previous year.
- Ideally, the amount should vary based on the number and scale of opportunities available each year.
- Basing investment decisions on EPS, net income, or return on equity: The compensation of managers is sometimes tied to EPS, net income, or ROE. They may therefore reject even strong positive NPV projects that reduce these accounting numbers in the short run.
- Pushing “pet” projects: Pet projects are projects backed by senior management. They may contain overly optimistic projections that overstate the project’s profitability.
- Failing to consider investment alternatives or alternative scenarios: During the
idea generationstep, many good alternatives are never even considered at some companies. Many companies also fail to consider differing states of the world, which should ideally be incorporated through breakeven, scenario, and simulation analyses.
Real Options
Real options are options that allow managers to make decisions in the future that change the value of capital investment decisions made today. As with financial options, real options are contingent on future events. The difference is that real options deal with real assets.
Types of real options include:
- Timing options: A company can delay investing until it has better information.
- Sizing options:
- If a company can invest in a project and then abandon it if its financial results are weak, it has an abandonment option.
- If the company can make additional investments when financial results are strong, it has a growth option.
- Flexibility options: Once an investment is made, operational flexibilities such as changing the price (price setting option), or increasing production (production flexibility option) may be available.
- Fundamental options: In this case, the whole investment is an option. For example, the value of an oil well or refinery depends on the price of oil. If oil prices are low, a company may not drill a well. If oil prices are high, the company may pursue drilling.
There are several approaches to evaluating capital allocation projects with real options.
- Use DCF analysis without considering options.
If the NPV of the project without considering options is positive, then we can go ahead and make the investment. The presence of real options will simply add even more value. Therefore, it is not necessary to determine the value of the options separately. - If NPV is negative without considering options, then calculate project NPV and check if it turns positive after the options are considered.
Project NPV = NPV (based on DCF alone) – Cost of options + Value of options.
- Use decision trees and option pricing models. They can help in many sequential decision-making problems.
Assume that Gerhardt Corporation is considering a €500 million outlay for a capital investment in a facility to produce a new product. Gerhardt assigns a 60% probability to a successful product launch, which is expected to return €750 million in one year’s time. Gerhardt’s finance team has also conducted an analysis of alternative facility uses, summarizing the timing and probability of cash flows associated with each real option in the following decision tree
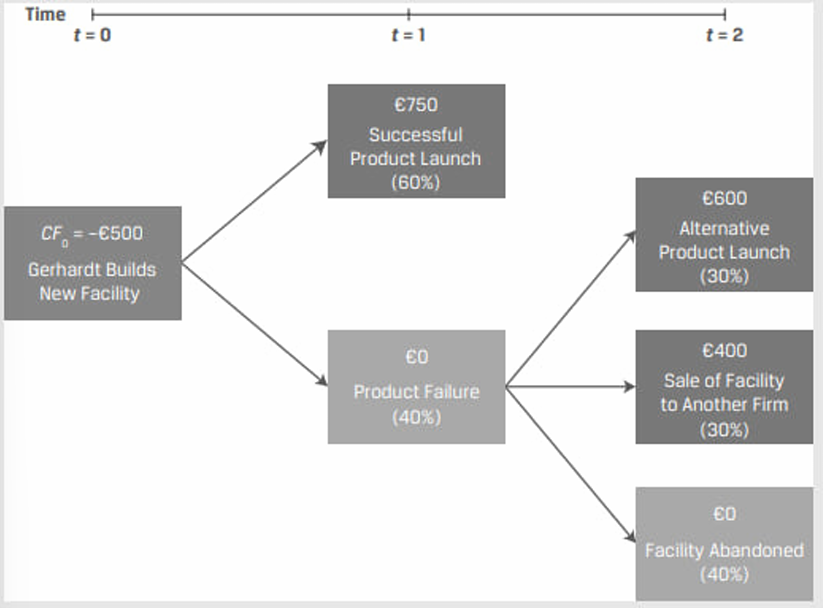
- Calculate the NPV of Gerhardt’s project without real options using a 10% required rate of return (r).
- Calculate the NPV of Gerhardt’s project with real options using a 10% required rate of return (r).
Solution
The NPV without real options is a probability-weighted cash flow if the product is successfully launched (60%) and a 40% probability that future cash inflows are zero.
- NPV =
Because NPV = –€90.91, Gerhardt should not pursue the project, based on the NPV decision rule.
The NPV with real options equals €8.26, which implies based on the NPV decision rule that Gerhardt should invest in the new production facility if alternative uses in the future are considered.